Definition
How do you calculate break-even ROAS?
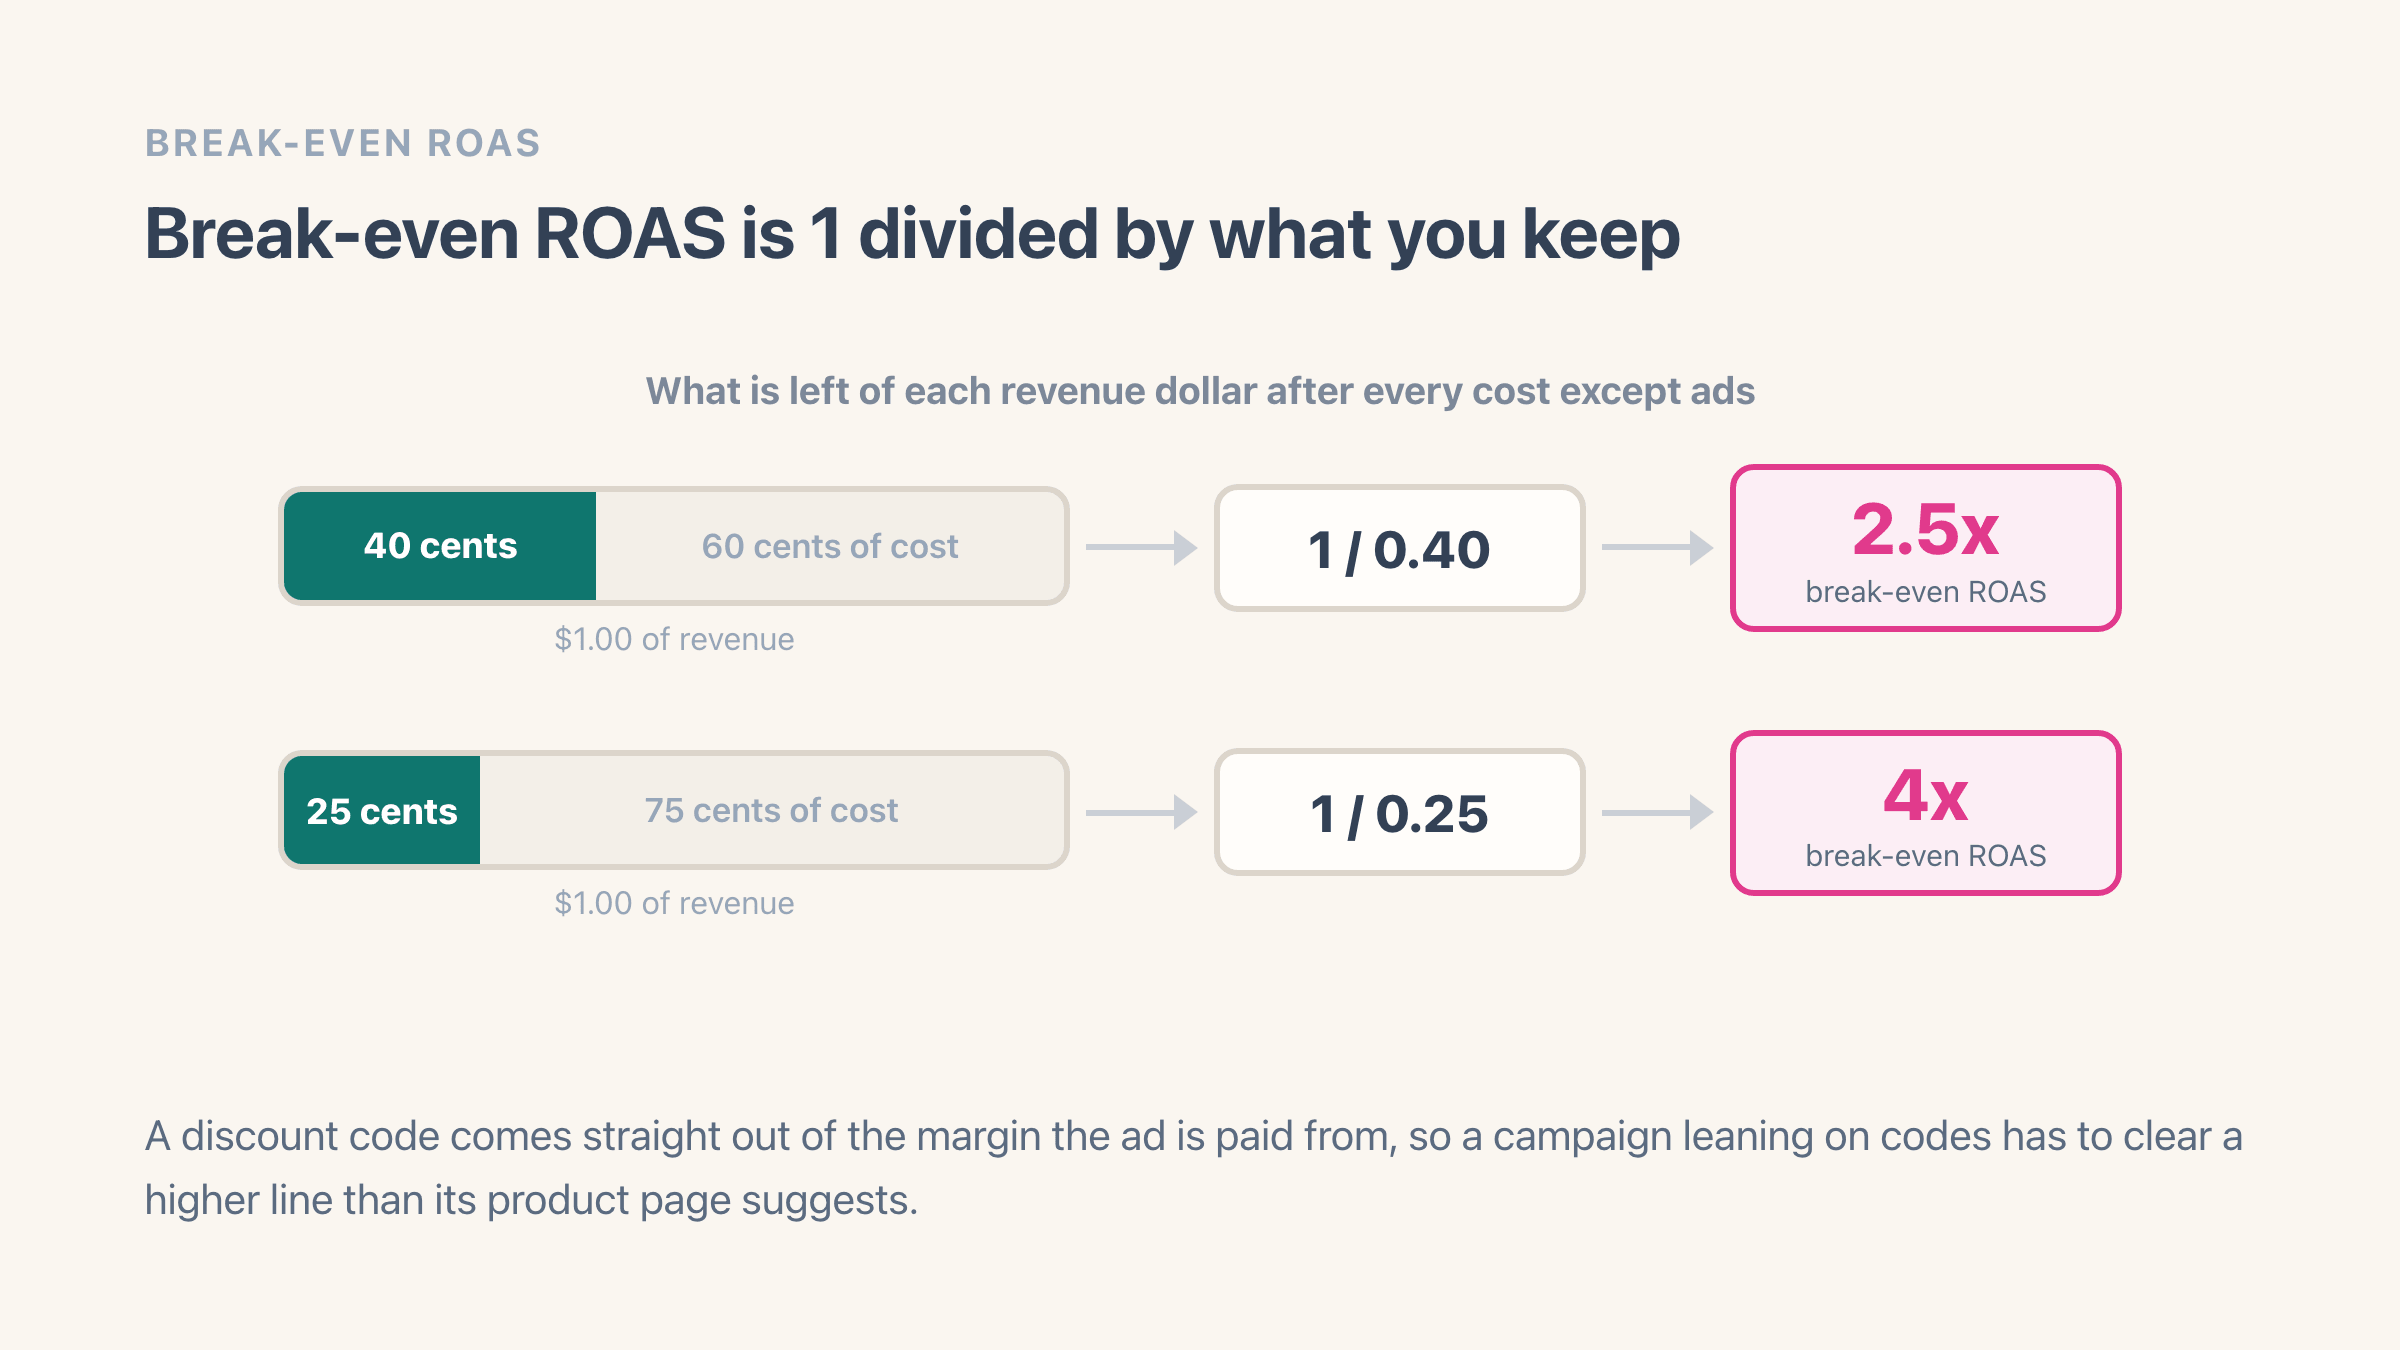
Divide 1 by your margin before ad spend, written as a decimal. Keep 40% and break-even ROAS is 1 / 0.40 = 2.5x. Keep 22% and it is 1 / 0.22 = 4.5x. That is the whole calculation, and the free profit margin calculator will run it for one product if you would rather type a price and a cost than do the division.
The reciprocal works because ROAS and margin sit on the same base. ROAS says how many revenue dollars one ad dollar bought, and margin says how much of each of those survives to pay for the ad. Multiply them: 2.5 x 0.40 = 1.00. One dollar of margin for one dollar of spend is what breaking even means, and every break-even ROAS is the ROAS that makes that product equal 1.
Running the multiplication yourself is the more useful habit, because it turns a ratio into money. A campaign returning 3.1x on a product that keeps 35 cents on the dollar bought $3.10 of revenue and $1.09 of margin per ad dollar, so it cleared nine cents. Nine cents per ad dollar is a very thin business, and that is a different conversation from being told the campaign hit 3.1x.
Which margin goes in the denominator, gross or contribution?
Neither gross margin nor net margin. The figure you want is what a sale leaves after every cost that moves with the order except the ad: the whole of your cost of goods sold including inbound freight and duty, the payment processor fee, the shipping you actually paid, packaging and the share of returns that product generates. That is contribution margin measured before ad spend, and it is the only pot an ad can be paid out of.
Gross margin is what most stores reach for, because it is the only margin Shopify hands them. Every variant has a Cost per item box on the product page in your admin, and Shopify's own profit reports use it for one job: sales minus that cost. Useful, and much too generous for setting an ad floor.
Take a $60 order with $24 of product cost. Gross margin is 60% and break-even ROAS looks like 1.7x. Now subtract the $2.10 processing fee, the $6 of shipping you absorbed and roughly $3.60 of return cost spread across that product's sales. What survives is $24.30, or 40.5%, and break-even moves to 2.5x. Same order, same day, and the gross-margin version had you relaxed about a 2x campaign that was losing 19 cents on every ad dollar.
Net margin fails in the opposite direction. Ad spend has already been subtracted from it, so feeding it into the formula solves for a number that depends on the answer. Judge the month on net margin. Judge the ad on the pre-ad figure.
What break-even ROAS do you need at 20%, 40% and 60% margin?
The ladder is flat at the top and vicious at the bottom, which is the most useful thing about it. Each point of margin you give away at the thin end costs far more ROAS than a point given away at the fat end.
That is also why margin is usually the easier lever. Lifting a product from 30% to 35% drops its break-even from 3.3x to 2.9x, and in our experience renegotiating a supplier price or adding a $4 shipping charge is more achievable than asking a campaign to find another four tenths of ROAS. Moving the margin moves the line. Ad creative has to jump it where it stands.
- 60% margin. Break-even 1.7x. A campaign at 3x earns 80 cents of margin per ad dollar.
- 50% margin. Break-even 2.0x. A campaign at 3x earns 50 cents.
- 40% margin. Break-even 2.5x. A campaign at 3x earns 20 cents.
- 30% margin. Break-even 3.3x. A campaign at 3x is 10 cents down on every dollar.
- 20% margin. Break-even 5.0x. A campaign at 3x loses 40 cents on every dollar you feed it.
Break-even ROAS vs target ROAS: which one kills a campaign?
Break-even kills a campaign. Target scales one. Break-even ROAS comes out of arithmetic and marks the point below which a campaign should be switched off. Target ROAS comes out of a decision about what you want the business to keep.
The gap between them is your fixed costs. Break-even only covers what the order itself consumes, so rent, salaries, software and your Shopify subscription are all still waiting to be paid out of whatever the orders contribute. A campaign parked exactly on break-even therefore pays for itself and puts nothing toward the month.
To set a workable target, take your monthly fixed costs, divide by the revenue you expect, and take that share off the margin the ad is allowed to use. Fixed costs at 12% of revenue against a 40% pre-ad margin leave the ad 28 cents of each revenue dollar, so the target is 1 / 0.28 = 3.6x while break-even stays at 2.5x. Everything between those two numbers is a campaign that funds itself and subsidises nothing else, which is how a store ends up with a full dashboard of winners and a month that still ends red.
Why break-even ROAS is different for every product
Because margin is different for every product, and margin is the only thing the formula looks at. A 62%-margin candle and a 24%-margin electronics accessory in the same catalogue break even at 1.6x and 4.2x. Run both under one 3x account-wide rule and you are throttling the candle campaign while the accessory campaign burns money with every dashboard showing green.
Campaigns then split further than products do, for four reasons worth checking before you set a floor:
- Basket mix. A campaign that sells the product in a bundle carries a different blended margin from one selling it as a single unit, even though the product page is identical.
- Shipping. With free shipping over a threshold, the same product absorbs different shipping cost depending on basket size, and a campaign that drives single-item orders eats more of it.
- Discount codes. A code the campaign created comes straight out of the pre-ad margin, which lifts that campaign's break-even without touching the product's.
- New customers. Judging a first-order campaign on that first order alone sets the floor higher than the lifetime value behind it warrants.
How discounts and returns raise your break-even ROAS
Both come out of the same pot the ad is paid from, so both lift the floor. A discount does it the moment the code is used and a return does it weeks later, which is why merchants notice one and miss the other.
A 15% code on a product with a 40% pre-ad margin does not leave you 25%. Revenue falls to $85 on what was a $100 order while the $60 of cost stays exactly where it was, so $25 of margin on $85 of revenue is 29.4%, and break-even climbs from 2.5x to 3.4x. That is a 36% higher bar for the identical campaign, and no ad platform mentions it. Our page on how discounts affect Shopify profit works through what that does across a whole promotion.
Returns are the same arithmetic on a delay. If 8% of units come back and you pay the return shipping plus a restocking pass on each one, the margin you divide into 1 has to be the margin after that 8% has already been taken out. Most stores instead use the margin on the units that stayed sold, which is the gross-margin mistake again, one step further down the chain.
Timing is what makes returns dangerous rather than merely expensive. A campaign judged on the 30th is being judged on a return rate that has not finished happening.
How to compare the ROAS in your ad account with your break-even
Put both numbers on the same revenue before you compare them, because by default they are not, and the gap alone can flip a campaign from passing to failing.
Your break-even was built on revenue you keep: after discounts, after refunds and, in a VAT market, with the tax taken out. The revenue in your ad account is whatever your store reported back to it at checkout, which is normally the full order total.
If your prices include tax, which they do across most of the EU at 19% to 25%, then that tax is sitting inside the figure the ad platform is congratulating you on. Shipping the customer paid usually rides along too, and a refund weeks later rarely finds its way back to the platform at all.
So restate before you judge. Take the campaign's reported revenue, strip the tax if your prices include it, take off the shipping the customer paid, subtract refunds that have landed since, then divide what is left by the spend the ad account actually billed you, including every click that produced nothing. In a 25% VAT market that first step alone drags a reported 4.0x down to 3.2x. If your break-even is 3.3x, the campaign you were about to scale is under water.
Where break-even ROAS shows up on your own Shopify orders
Shopify does not calculate it. Cost per item gets you to gross margin and the reports stop there. The payment fee, the shipping you actually paid, the return costs and the ad spend all sit outside Shopify, so break-even ROAS has to be assembled.
Easy Profit Calculator does that assembly line by line on every order. It takes what the line sold for, subtracts the product cost, the landed cost, that line's share of the payment fee, the shipping cost, the return impact and whatever other per-order fees are left, then divides what the line sold for by what survives. Ad spend is the one cost left out on purpose, since that is the number being solved for. Where a line has nothing left before ads, no break-even is stored at all, because no return on ad spend makes that sale profitable.
You meet the result in three places. The Products report has a Break-even ROAS column, off by default, so the catalogue can be ranked by the floor each product sets. Each product's own report page carries the same figure. And on an order, a line shows its break-even next to the costs that produced it.
How does ad spend get matched to an order?
Ad spend arrives from the other side. Google Ads syncs on its own: spend, clicks, conversions and conversion value for each campaign each day, plus per-product rows from Shopping and Performance Max campaigns. Spend on every other channel, Meta included, is entered by hand.
Orders then match by product first, when the SKU on an order line turns up in that day's ad numbers. Whatever does not match a product is matched by the campaign tag on the link the shopper arrived through. Orders that match neither are left with no ad cost rather than a guess, and the ones matched on the campaign tag are labelled estimated.
What does the Campaign ROAS report show?
The Campaign ROAS report puts Revenue ROAS and Profit ROAS in adjacent columns per campaign. Profit ROAS is computed on profit before ad spend, the same figure the break-even formula divides into 1, so break-even on that column is exactly 1.00x and a campaign reading 0.9x lost money.
That report needs the Pro plan, $19 a month for up to 2,000 orders. The Free plan covers 100 orders a month and includes the per-line break-even and the Products report. The mechanics are in the docs on how profit is calculated and ad attribution.
Example
A campaign reports 4.0x, and the product keeps 31% of revenue before ads, so break-even is 3.2x. That looks like a 25% cushion. Prices include 25% VAT, though, so the revenue you actually keep is 3.2x the spend and the campaign is sitting exactly on its floor. One 15% discount code takes it under.
Commonly confused with
- Target ROAS
- Break-even is the line below which a campaign loses money. A target is set above it so the campaign also pays something toward rent, salaries and software.
- ROAS
- ROAS is what a campaign returned. Break-even ROAS is the number it had to beat, and it comes out of your margin rather than out of the ad account.
- ACOS
- ACOS is ad spend as a percentage of the revenue it brought in, so it is the same relationship upside down. A 25% ACOS is a 4x ROAS.