Definition
Is ROAS the same as profit?
No. ROAS puts revenue on top of the fraction, and revenue is gross. Out of it come the product cost, the payment fee, the shipping you absorbed and the parcels that come back. Whatever survives all that, before the ad itself is paid for, is the only money an ad can come out of. That figure has a name: contribution margin.
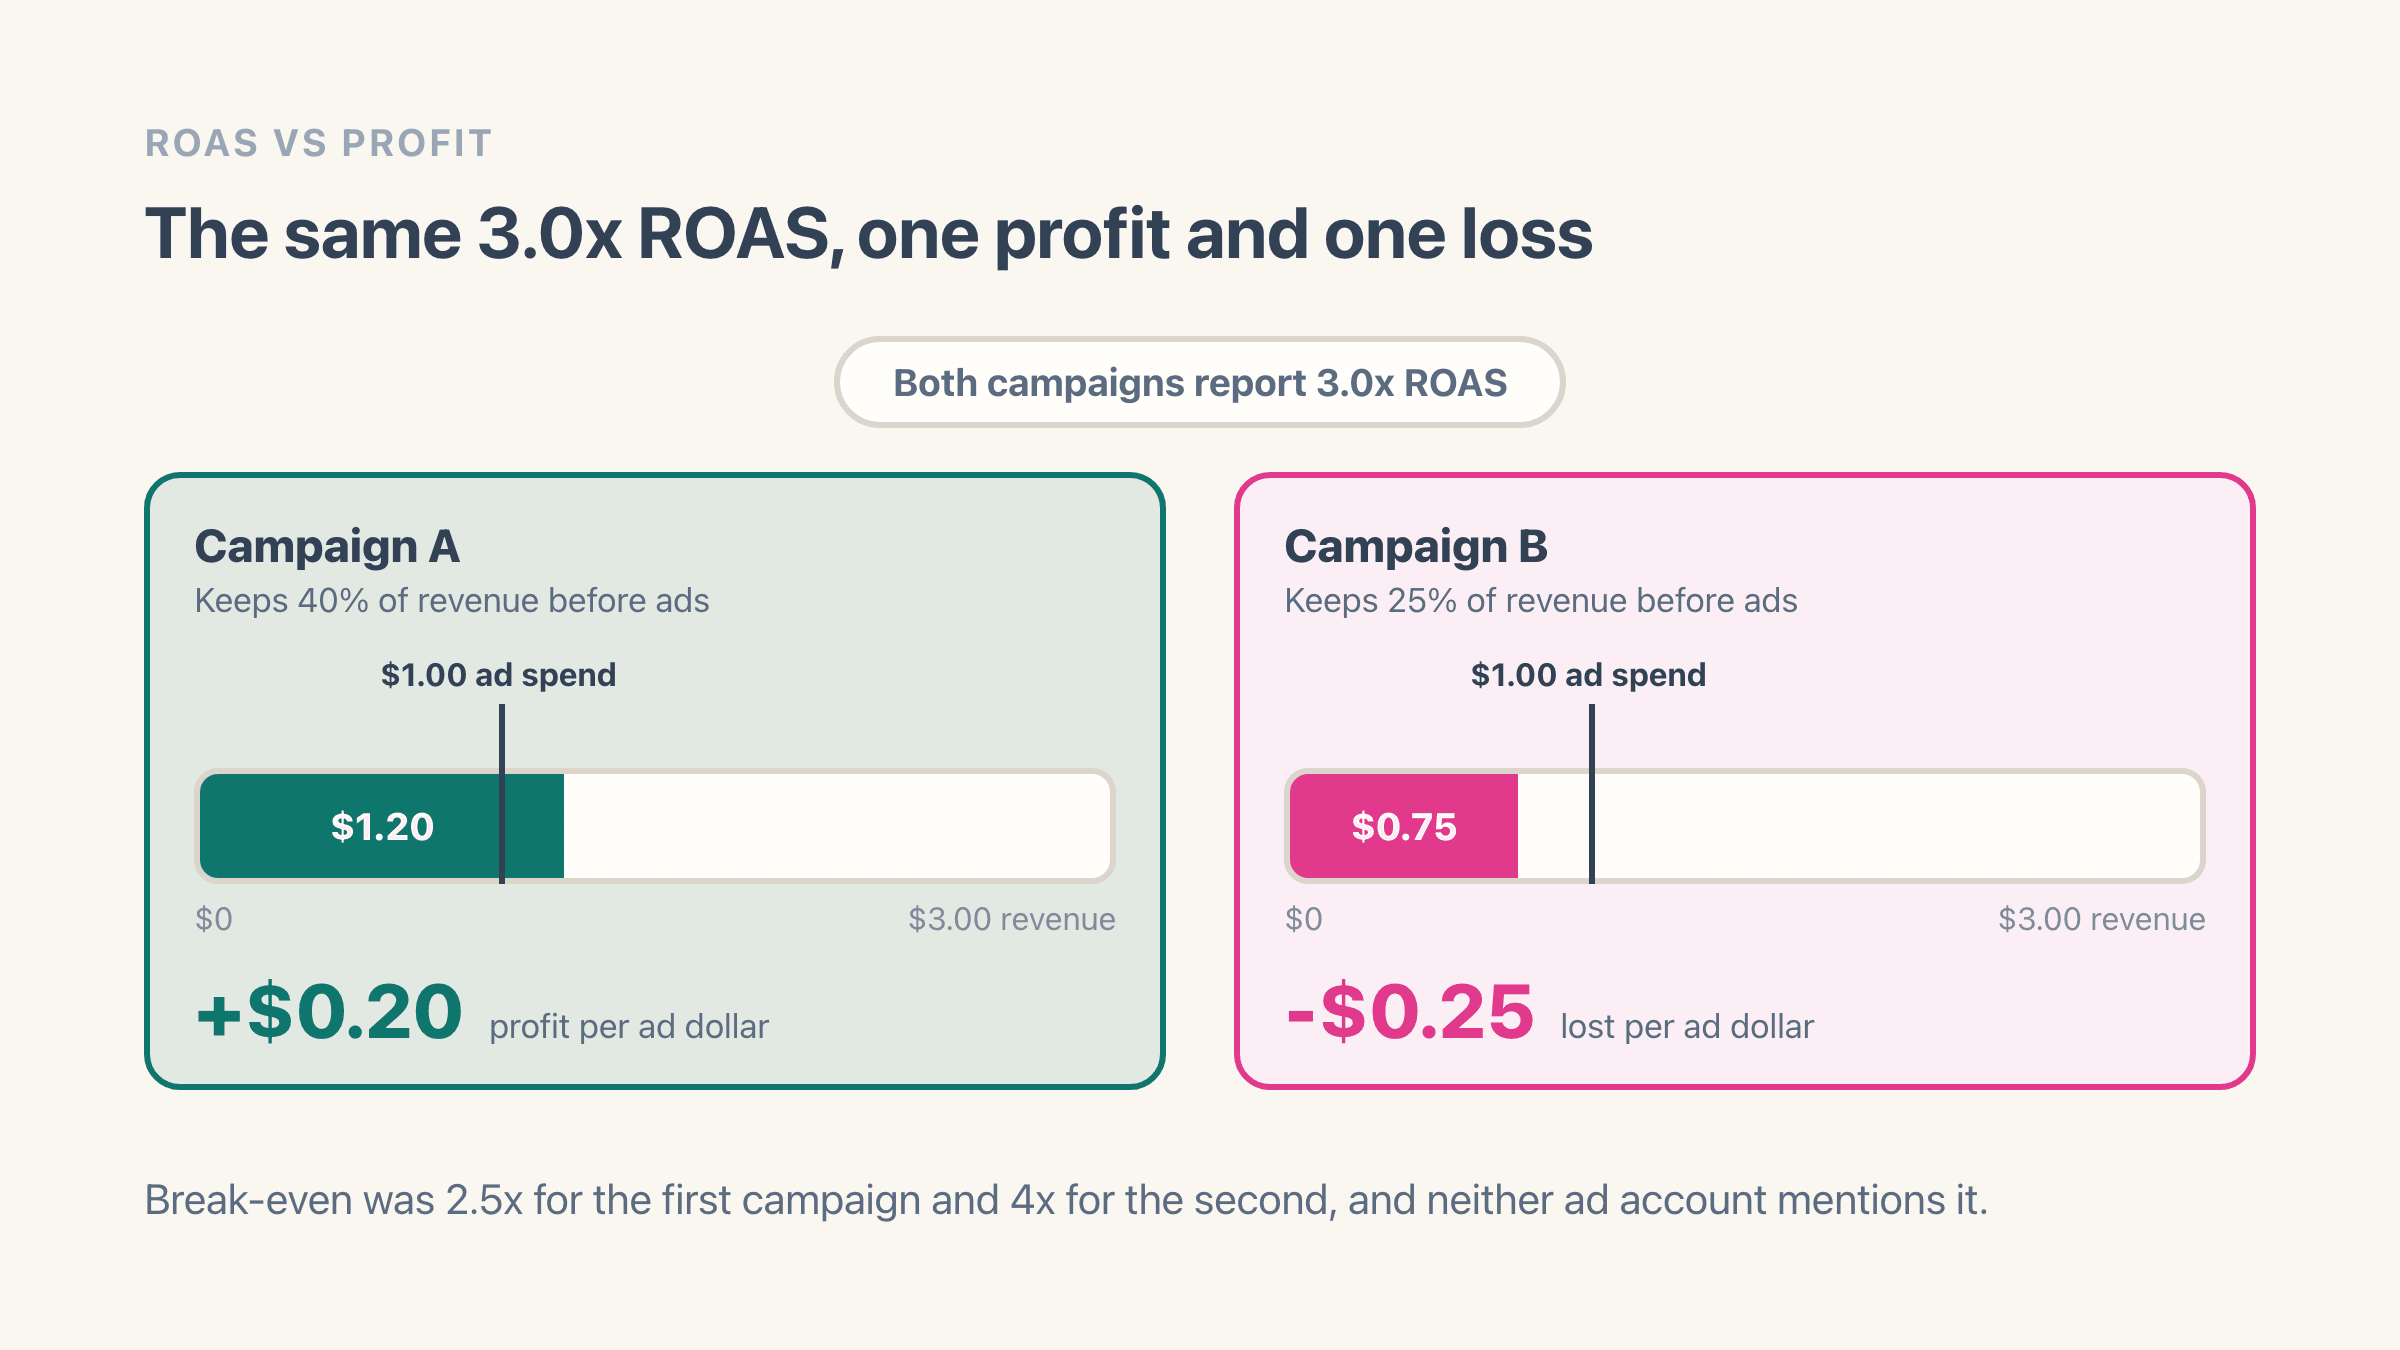
So the same ROAS means opposite things on two different products. Where 40 cents of every revenue dollar survives to the pre-ad line, a 3x campaign turns $1 of ad spend into $1.20 of margin and hands you 20 cents. Move that same 3x onto a 25%-margin accessory and the $1 buys 75 cents of margin. You are down a quarter on every ad dollar, and the ad account still reports 3x.
This is how a store scales itself into a loss with nothing visibly breaking. The campaign hits its ROAS target every week. The target came from a blog post rather than from the store's own margin, and every report keeps agreeing with every other report right up until the bank balance stops agreeing with all of them.
What ROAS do you need to break even?
Divide 1 by your margin before ad spend. Keep 40% and you break even at 2.5x. Keep 25% and you need 4x. Keep 60% and 1.7x will do. That is the entire formula, and break-even ROAS works through where the margin figure comes from and why gross margin overstates it.
One number will not cover a whole store, though. Margins differ across a catalogue, so the campaign pushing your best product can survive a ROAS that would sink the campaign pushing your thinnest one. Discounts move the target as well. A code taking 15% off the order takes it straight out of the margin the ad has to be paid from, which is why campaigns leaning on codes need a higher ROAS than their product pages suggest.
Why the ROAS in Google Ads never matches the ROAS in your own reports
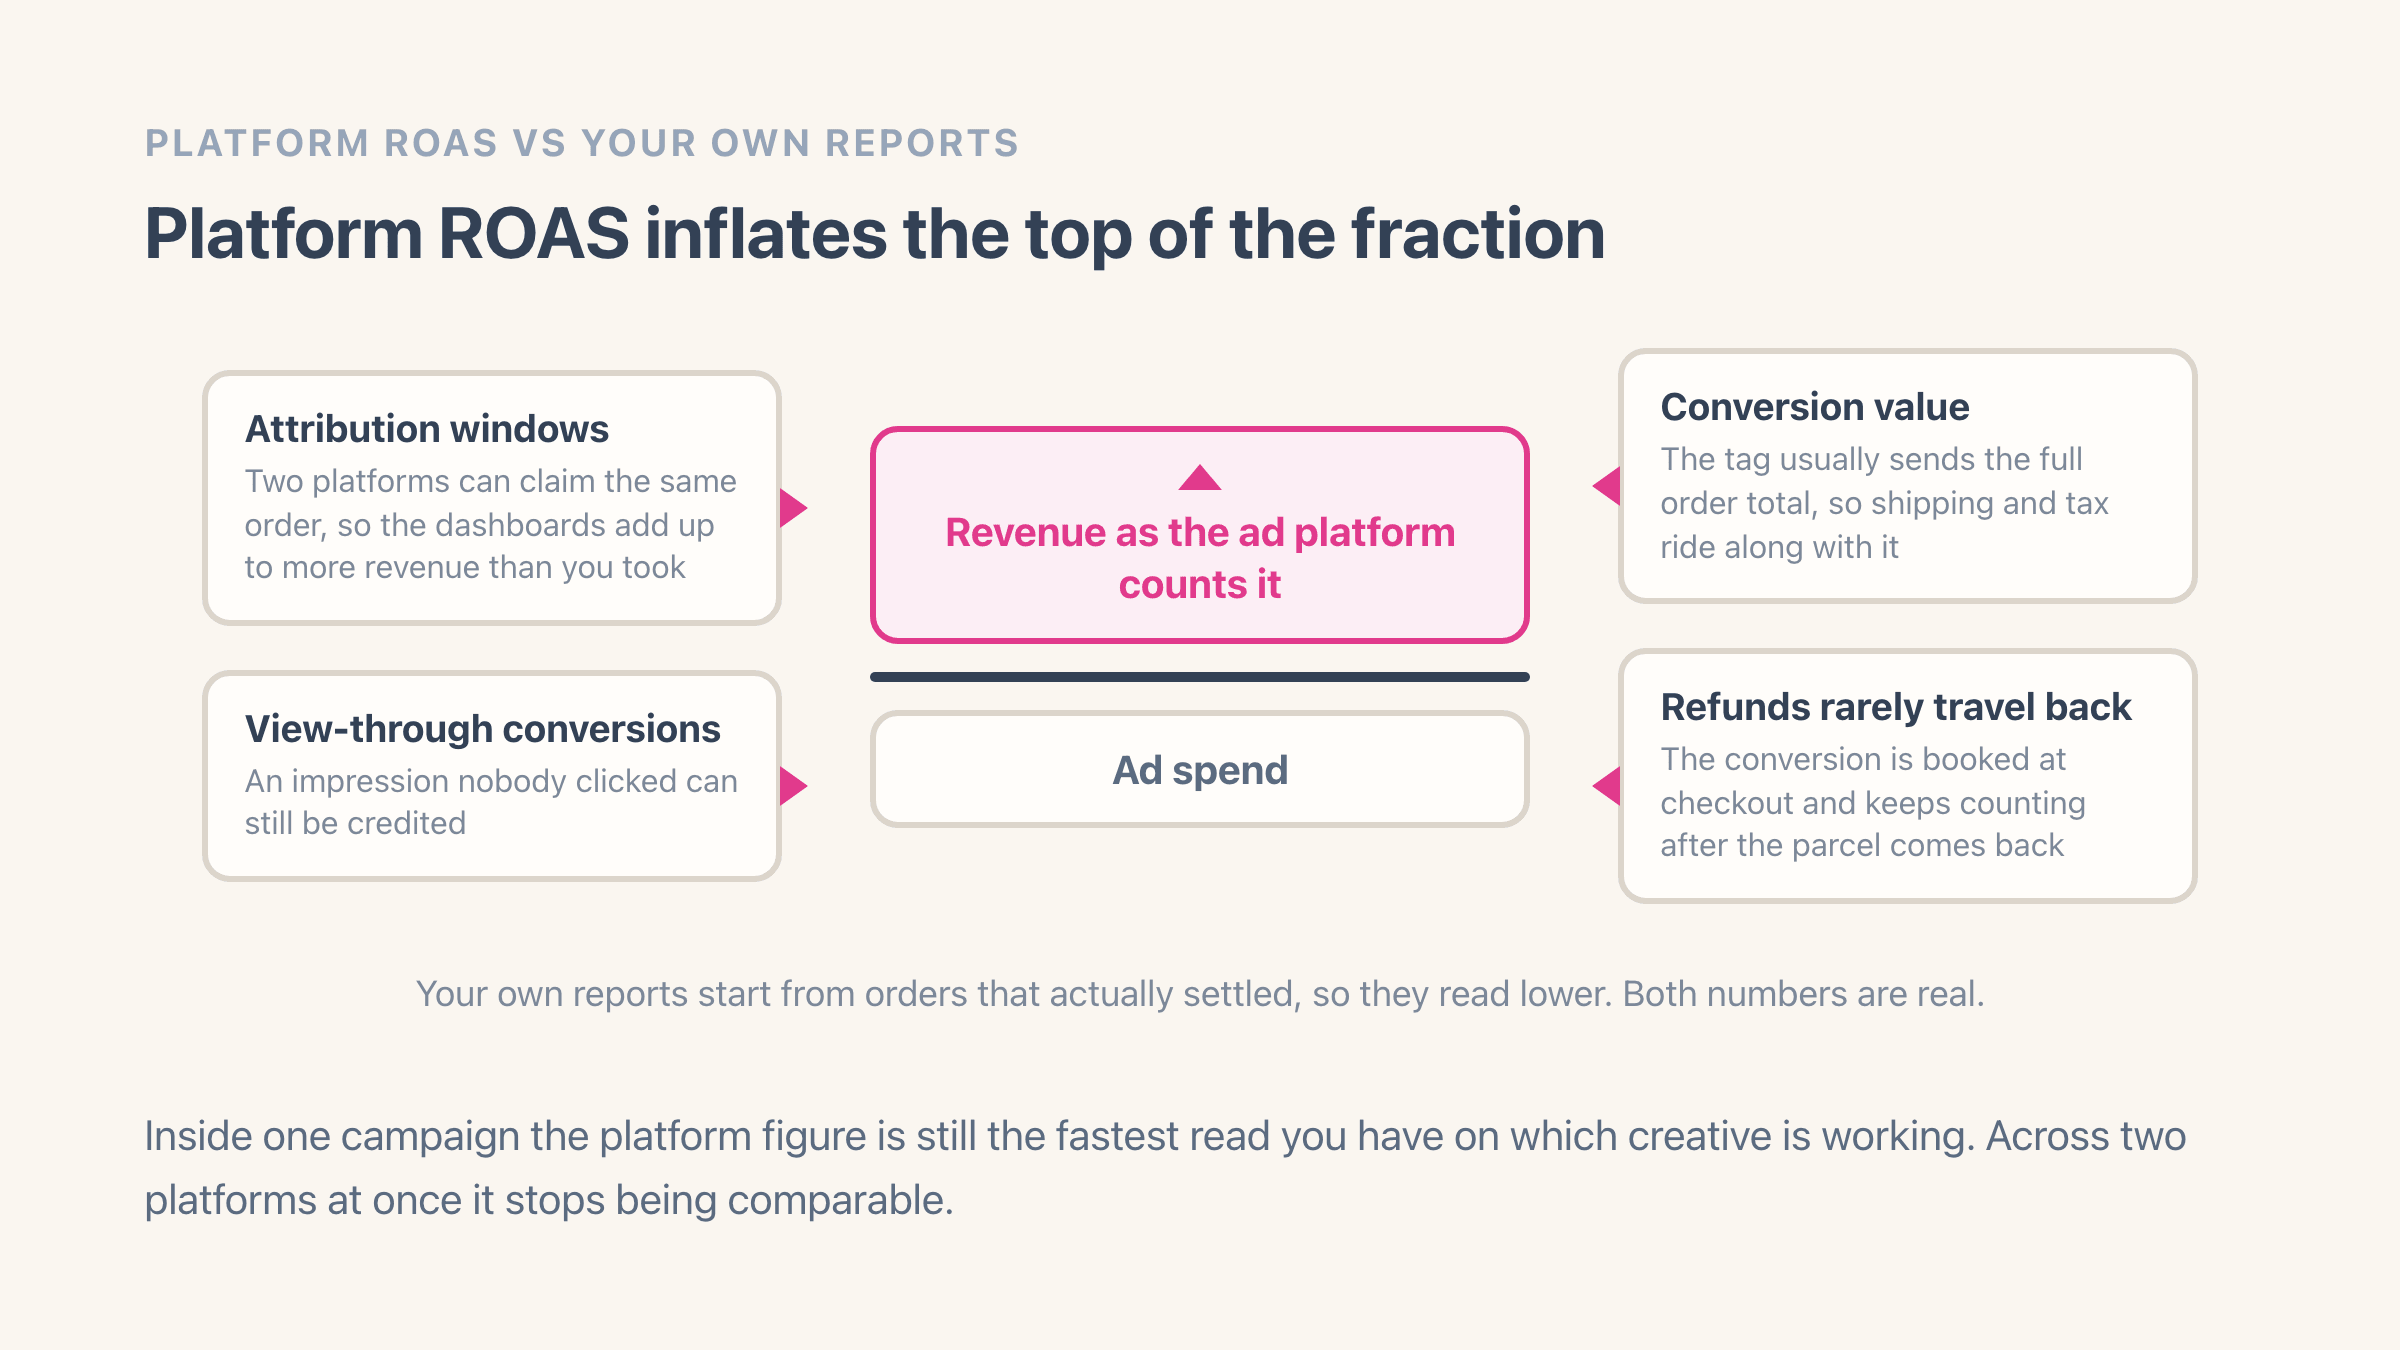
Both numbers are real. They measure different things, and the one an ad platform reports is the one that flatters the ad platform. Five differences account for most of the gap.
None of that makes the platform figure useless. Inside a single campaign it is the fastest read you have on which creative and which audience are working, and it updates faster than your accounting ever will. Across campaigns, and especially across two platforms at once, it stops being comparable. That is the point to switch to a number computed from your own orders.
- Attribution windows. Each platform counts an order as its own when a click or an impression lands inside the window it chose. Run two platforms at once and the same order gets claimed twice, so the dashboards add up to more revenue than your store actually took.
- View-through conversions. An impression nobody clicked can still be credited, which lifts the top of the fraction without a single visit from that ad.
- The recorded order value includes money you never keep. What an ad platform records against a sale is usually the full order total, so shipping and tax ride along with it. In a VAT-inclusive market that is 20% to 25% of the order that was never yours.
- Refunds rarely travel back. The platform books the sale at checkout and, unless refunds are fed back to it, goes on counting an order that came back three weeks later.
- The platform grades its own work. No ad account has ever been asked to produce your supplier invoice.
Blended ROAS vs platform ROAS: which one do you act on?
Blended ROAS divides revenue by total ad spend across every channel, the same number some people report as MER, or marketing efficiency ratio. It answers a budget question - is the advertising operation as a whole paying for itself - while platform ROAS answers the narrower question of which ad to keep running this week.
Check which revenue a blended figure uses before you compare it with anyone else's. Some tools divide all store revenue by ad spend, which counts your organic and repeat-customer sales as a return on advertising and makes paid look far better than it performs. Others divide only the revenue they could attribute to ads, which is stricter and lands lower. Two stores quoting the same blended ROAS can each be using a different one of those definitions.
Both versions still put revenue on top. Swap that for profit before ad spend and the reading gets easier straight away, because break-even then lands at exactly 1.0x instead of moving every time your product mix changes.
Why "average ROAS" is a number you cannot use
Averages get quoted constantly and almost none of them survive contact with your own margin. A ROAS average pools 70%-margin skincare with 20%-margin electronics, stores whose demand is mostly organic with stores buying every single visit, and ad accounts sitting on completely different attribution settings. The arithmetic works. The comparison does not.
If a page hands you an average ROAS without naming the product category behind it, the margin, and how conversions were attributed, it has averaged three different measurements and printed the result. Anyone selling on Shopify can test this in a minute: work out your own break-even from your own margin and compare it with the average you were quoted. The two rarely land anywhere near each other.
The benchmark that governs your decisions is your own break-even, and the trend worth watching is your ROAS against that line month over month. We do not publish an average ROAS for our own users for exactly this reason. Any figure we could quote would be an average of stores that have nothing to do with yours.
Why is my ROAS good but my profit is not?
Because break-even ROAS only covers what an order itself costs, so everything else in the business sits outside the test. Clearing break-even on your attributed orders and having money left at the end of the month are two separate questions, and a store can pass the first while failing the second for months.
One thing pulls the other way, and it wants evidence before you lean on it. A campaign that wins customers who come back is being judged on one order out of several, which is what customer lifetime value measures. Check that against your own repeat data first, because a repeat rate you have assumed is the most expensive number on this page.
These are the causes we run into most.
- Fixed costs sit outside the ROAS maths entirely. Break-even ROAS only covers what the order itself costs. Rent, salaries, app subscriptions and your Shopify plan come out of whatever is left over, which is the whole jump from contribution margin to net profit.
- Unattributed spend still gets billed. The break-even test divides profit by the spend that could be tied to an order, while the ad account charges you for every click, including all the ones that produced nothing.
- Returns land after the report. A campaign's ROAS on the 30th is a forecast until the returns settle, and the campaigns that sell fastest are often the ones that come back hardest.
- Discount codes come out of the same margin. A code used by the shoppers a campaign brought in shrinks the pre-ad margin that campaign is then judged against, and most ROAS reporting never subtracts it.
- Tax-inclusive revenue inflates the top of the fraction. If your prices include VAT, the order total the ad platform recorded contains 20% to 25% that goes straight to the tax authority.
How to see profit ROAS on your own Shopify orders
Three things have to line up: a real cost picture per order, ad spend matched to those orders, and a report that divides one by the other. Shopify covers part of the first. It stores a Cost per item on every variant, which gets you to gross margin, and stops there. Your carrier invoice, your return costs and your ad accounts all live outside it.
That gap is what Easy Profit Calculator closes. Google Ads syncs live - spend, clicks, conversions and conversion value per campaign per day, plus product-level spend from Shopping and Performance Max - and spend on every other channel is entered by hand.
Each order then gets its ad cost matched two ways. First by product, when something in the order also shows up in that day's ad spend for a campaign. Then by campaign, read from the tracking tag on the link the shopper clicked, for the orders that did not match on a product.
Orders matching neither are left with no ad cost at all rather than a guessed one, and the campaign-matched ones are labelled estimated so you can see which half of the report to lean on.
The Campaign ROAS report then sets Revenue ROAS and Profit ROAS in adjacent columns for the same campaign, with spend, orders, revenue and profit alongside them. Profit ROAS is calculated on profit before ad spend, which is deliberate: it puts break-even at 1.0x on that column, so a campaign reads as above or below the line with no arithmetic in your head. That report needs the Pro plan. The mechanics are written up in the docs on ad attribution and blended ROAS and the Campaign ROAS report.
Example
Two campaigns both report 3.0x. Campaign A sells a product keeping 40% of revenue before ads, so $1 of spend brings $3 of revenue, $1.20 of margin and 20 cents of profit. Campaign B sells a 25%-margin accessory, so the same $1 brings $3 of revenue but only 75 cents of margin, and loses 25 cents. Break-even was 2.5x for A and 4x for B. Neither ad account mentions it.
Commonly confused with
- Profit
- ROAS puts revenue on top of the fraction, and that revenue still has to pay for the product, the fees, the shipping and the parcels that come back before any of it is profit.
- Break-even ROAS
- ROAS is what a campaign returned. Break-even ROAS is the line it had to clear, and it comes from your own margin rather than from the ad account.
- Blended ROAS or MER
- Blended ROAS divides revenue by total ad spend across every channel, so it answers a budget question. Platform ROAS answers the narrower one of which ad to keep running this week.