Shopify profit margin calculator
Profit margin is your profit as a share of the price: a $60 product that cost you $24 keeps $36, which is a 60% gross margin. Enter your own numbers for gross margin, net margin, markup, profit per order, and the break-even ROAS your ads have to beat. Add shipping and fees to see the net. Runs in your browser - nothing is stored or sent.
Your numbers
Optional - for true net profit
Your margin
Enter a selling price and product cost to see your margin.
The math
How to calculate profit margin
Four numbers do most of the work. The calculator above runs all of them for you, but here is what each one means and how it is worked out.
Gross profit margin
(Selling price - Product cost) / Selling price x 100Your profit as a share of the price, counting only what the product cost you. The headline number most people mean by "margin".
Net profit margin
(Selling price - all costs) / Selling price x 100The same idea after every cost - payment fees, shipping, ad spend, returns. This is the figure that tells you if you actually made money.
Markup
(Selling price - Product cost) / Product cost x 100Profit as a share of the cost, not the price. A 50% margin is a 100% markup: the same profit, measured against the cost instead of the price.
Break-even ROAS
Selling price / profit per order (before ads)The return your ads must beat to break even on an item. Spend below it and the campaign loses money, whatever the ad platform reports.
Worked example
How much profit does a $60 product with a $24 cost make?
Gross profit is $36 and gross margin is 60%. Take out a $6.50 shipping label, a $1.74 card fee and $18 of ad spend and the same item nets $9.76, which is a 16.3% net margin.
Every line, in the order the money leaves:
Price and cost
$60 charged, $24 paid to the supplier. Gross profit $36, gross margin 60%.
Shipping you absorb
$6.50 for the label on a free-shipping order.
Card fee
$1.74, at 2.9% of the $60 charged.
Profit before ads
$27.76. This is the figure your ad budget has to fit inside.
Ad spend
$18 attributed to the sale. Net profit $9.76, net margin 16.3%.
Type those five figures into the calculator at the top of this page and every line comes back the same, down to the $27.76. Nothing here is rounded to make a point.
The distance between 60% and 16.3% is three costs that never appear next to the price in your Shopify admin. I run a store doing around $5M a year, and this gap is the reason a good-looking product line can sit flat in the bank for a quarter. For the full order-level version, with returns and fixed costs folded in, see how to calculate net profit on Shopify.
Margin vs markup
Is a 60% margin the same as a 60% markup?
No. A $60 item that cost you $24 carries a 60% margin and a 150% markup, out of one $36 of profit. Margin divides the profit by the price. Markup divides the same profit by the cost. The two only ever agree when the profit is zero.
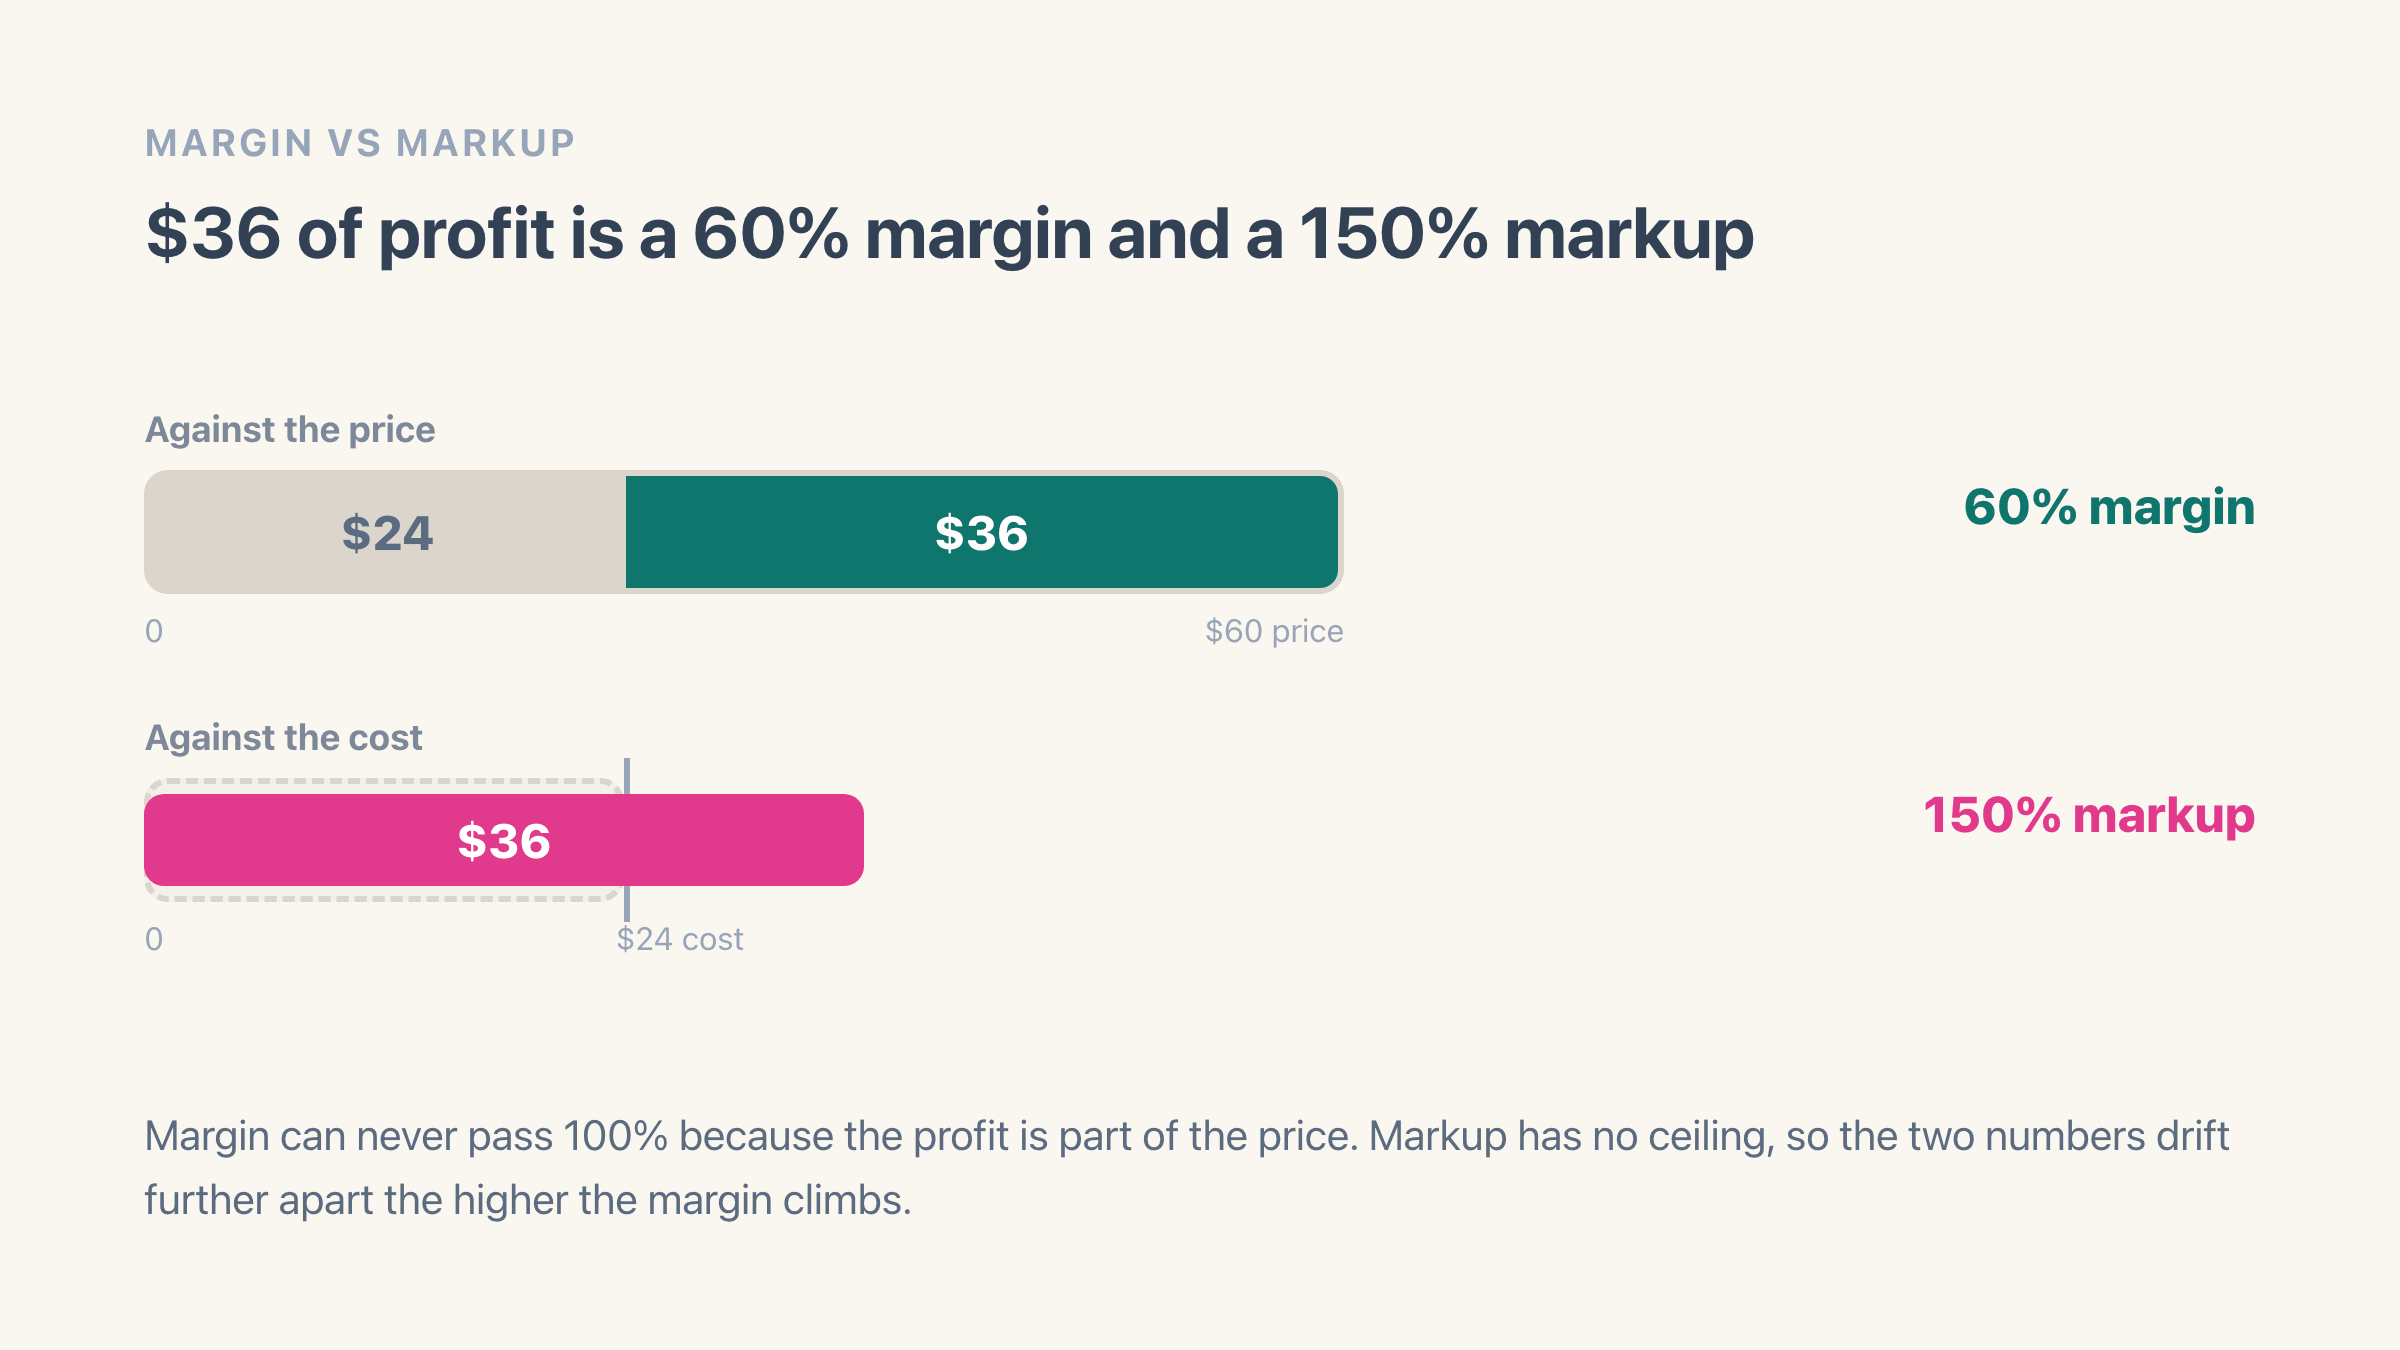
Mixing them up costs money in one direction only. Price a $24 product for a "50% markup" while thinking in margin and you charge $36, keep $12, and land on a 33.3% margin. You expected half the price to be yours. A third of it is.
| Gross margin | Same profit, as a markup |
|---|---|
| 20% | 25% |
| 30% | 42.9% |
| 40% | 66.7% |
| 50% | 100% |
| 60% | 150% |
| 70% | 233.3% |
To go either way without the table, divide the margin by one minus the margin to get the markup, or the markup by one plus the markup to get the margin. The calculator above prints both from a single price and cost, so you never have to pick a side. What profit margin means on a Shopify order covers where each version turns up in the admin.
Gross vs net
Why is your net margin so much lower than your gross margin?
Because gross margin only looks at what a product cost you. It is a useful first number, and it quietly ignores everything that happens between the sale and your bank account.
The $60 item above went from a 60% gross margin to a 16.3% net margin on three costs: payment fees, the shipping you absorb on free-shipping orders, and the ad spend that won the sale. Add the returns that come back and it goes lower again. That is why two stores with the same headline margin can have completely different bank balances.
Fill in the optional fields in the calculator - shipping, payment fee, other cost per order - and watch the net margin move. That gap between gross and net is where most of the profit leaks in ecommerce. For the full breakdown of what goes into a real profit number, see how profit is calculated.
Benchmarks
What is a good profit margin for a Shopify store?
There is no single right answer - it depends on what you sell and how you sell it. As a rough guide for product businesses:
Gross margin
Often 50 to 70% for a healthy product business. Below ~40% leaves little room for ads and returns.
Net margin
Commonly 10 to 20% once every cost is counted. Positive and steady beats a big number that swings.
Dropshipping
Usually much thinner - single-digit net margins are common because ad spend eats most of the gross.
Handmade / premium
Can run higher, but lower volume, so the profit per order matters more than the percentage.
The benchmark that matters most is your own margin over time, per product. The Shopify product profit report in Easy Profit Calculator tracks it automatically.
In your admin
Does Shopify show profit margin without a calculator?
Partly, and the limit is sharper than most people expect. Fill in the Cost per item box on a variant and Shopify builds five profit reports under Analytics > Reports:
- Gross profit by product
- Gross profit by product variant
- Gross profit by POS location
- Profit margin by order
- Average profit margin by market
The first three stop at the cost of the goods. Shopify's reporting field reference defines gross profit as net sales minus the cost of goods sold, and there is no shipping in that. The last two reach wider: Shopify's profit reports help page says the relevant metrics there cover the product charges, shipping charges, duties and import taxes your customer paid, plus the product costs, shipping costs, duties and import taxes your store paid.
Read that sentence carefully before you lean on it. It lists the metrics those two reports carry, and it does not say your real label cost has been taken off the margin. We could not find the arithmetic behind that figure published anywhere.
So the order-level number gets closer to the truth than the product-level one, and it is still worth checking against what you actually paid the carrier.
What no Shopify report subtracts is ad spend, app subscriptions, the card fee or your own wages. The profit reports page does not mention any of them. There is no profit and loss statement in the admin either. The closest thing is the Finance summary report, and its profit line is gross profit, so it stops in the same place.
None of this is plan-gated, whatever you may have read. Shopify's Basic plan page says the plan comes with access to all reports, the Starter plan page lists profit reports by name, and the profit reports page states no plan requirement at all. Cost data is the gate, not price. Our page on why Shopify gross margin reads high covers what a half-costed catalogue does to the figure.
Before you trust it
Why is my Shopify profit report empty?
Almost always because the products sold before their cost existed. Shopify's help page puts it plainly: profit is reported only for products and variants that had cost recorded at the time they were sold.
Five prerequisites decide whether you see anything at all:
Costs do not backfill
Shopify calls Cost per item static data, and says the profit reports are therefore only relevant to a specific point in time. A cost you type today does nothing for last month.
Every variant carries its own figure
Cost per item sits on the product or the variant, so a product in three sizes needs the number typed three times.
An uncosted variant is left out, not zeroed
Its sales vanish from the report instead of showing as pure profit. Shopify warns you may see a discrepancy between the net sales in your sales reports and in your profit reports, and this is what causes it.
Gift cards are excluded
Shopify says Cost per item does not apply to gift card products at all.
Charge tax on this product hides the number
Tick it and Shopify stops showing the profit and margin lines on the product page. That covers most physical goods. The reports still work; the figure just is not where you looked.
For a catalogue rather than one product, Shopify's product details help page points at two native routes: the bulk editor, where you add a cost column to the table and type down it, and the product CSV import, which carries a cost column of its own. The same page carries the gift-card and Charge tax rules. Neither route touches an order that already shipped.
So set the cost before the selling starts. It is the one part of this you cannot fix later.
Ads
What return do your ads need to break even on a $60 product?
2.16x, on a $60 item that cost you $24. Divide the price by the profit left before ad spend: $60 divided by $27.76 is 2.16.
At exactly 2.16 the order pays you nothing. At 3x you keep money. Under 2x you are buying revenue with your own cash and the ad account still calls it a return.
Your ad platform cannot tell you which of those you are in. It reports the same 3x for a product keeping 60% and a product keeping 25%, and only one of those is a win. Margin moves per product, so the return each product needs moves with it. Break-even ROAS runs the same division on thinner margins.
Limits
What does this profit margin calculator not cover?
Five things it does not do, so you know when to stop trusting it:
- One item at a time. It knows nothing about the other 400 products in your catalogue.
- The card fee is the rate you typed, not the fee Shopify charged. Only a Shopify Payments store has the real per-transaction figure recorded against the order.
- Returns are missing. A 6% return rate on the $60 item at $15 a return is $0.90 an order, over half the card fee.
- Rent, salaries, apps and your Shopify plan are left out deliberately. Fixed costs come off the month, never off one order.
- Nothing is saved. The figures live in this browser tab and go when you close it.
On that second one, the rate to type depends on your plan and the card the customer used. Every fee Shopify takes on a sale lists them, including the ones that only apply when you do not use Shopify Payments.
The gap all this leaves is the expensive one. These figures price a product. They cannot tell you which of last month's orders lost money, and that question needs your real order data.
Easy Profit Calculator does that job. Its free plan covers 100 orders a month and gives you net profit per order plus the negative-profit orders report.
Two things it will not do. It works on orders you have already taken, so it cannot price a product you have not sold yet. And ad spend only imports by itself from Google Ads, on the paid plans; on the free plan every ad cost is typed in.
FAQ
Shopify profit margin calculator FAQ
The questions this page does not already answer under a heading.
How do you calculate profit margin?
What is the difference between margin and markup?
What is the difference between gross margin and net margin?
How do I see the profit margin for my whole Shopify store?
Does Shopify calculate profit margin automatically?
Which Shopify plan do I need to see the profit reports?
How do I include ad spend in my profit margin?
This does one item. Easy Profit Calculator does your whole store.
See real profit and margin for every order, product, and month - automatically, after product cost, payment fees, shipping, returns, and ad spend. No spreadsheets, no guessing.
Free plan, no credit card required.
More free Shopify tools. See all free tools.