Definition
Revenue LTV vs profit LTV
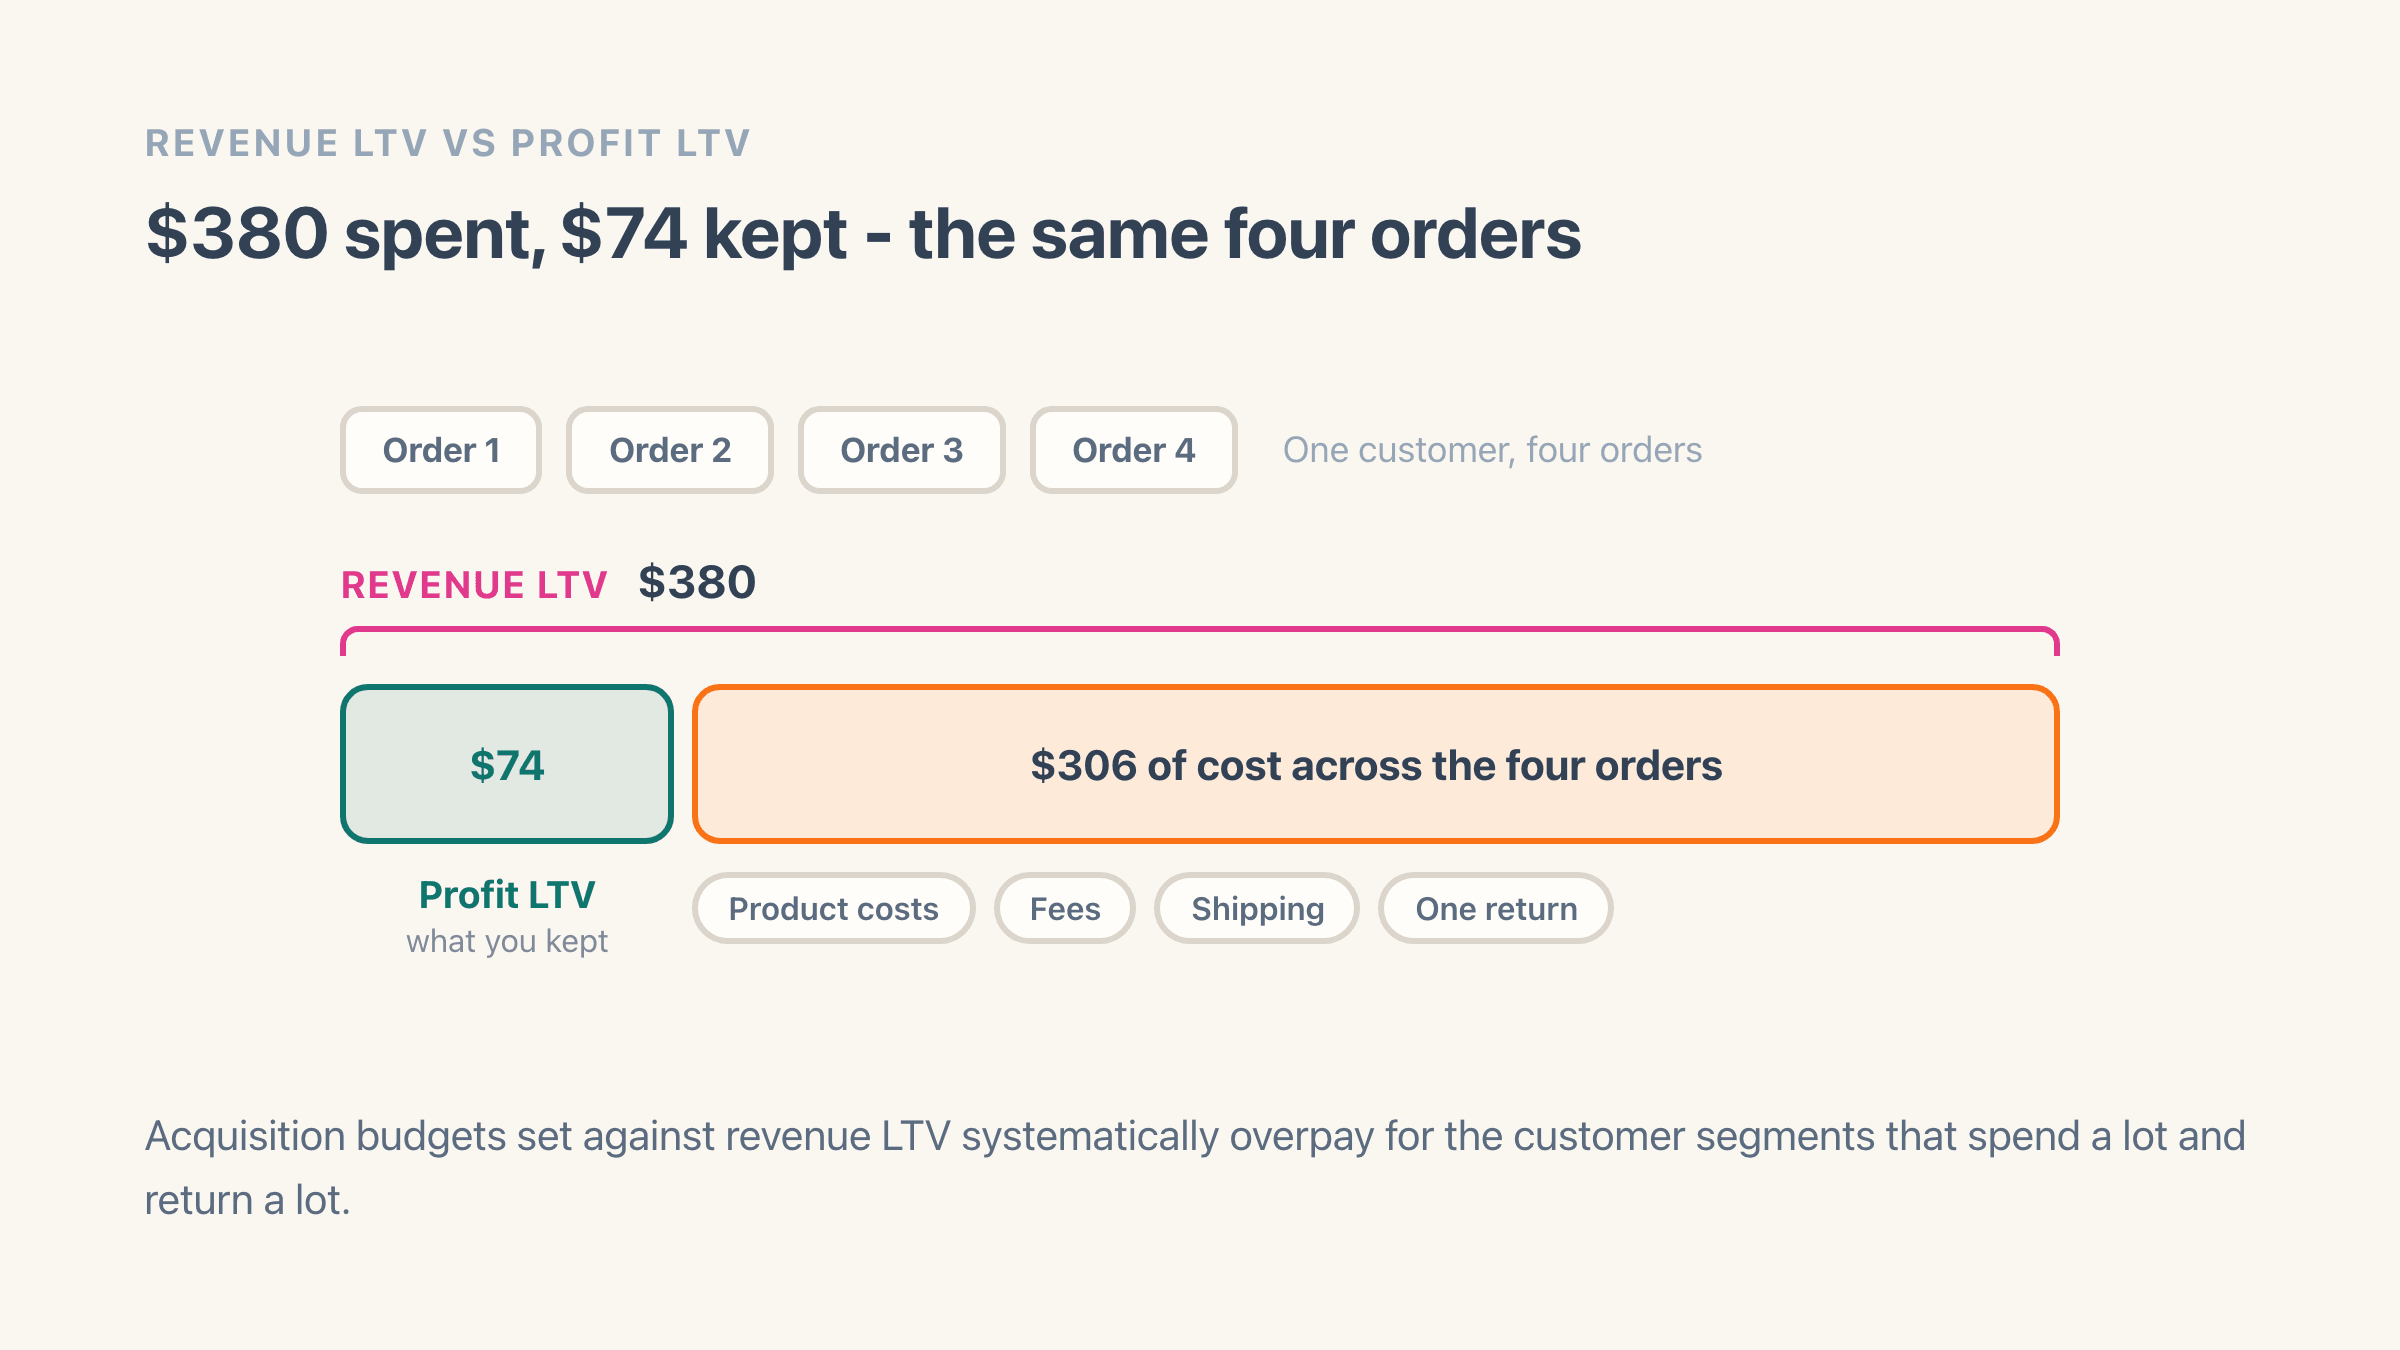
Revenue LTV answers "how much did this customer spend". Profit LTV answers "how much did we keep". The gap between the two is everything you gave away along the way: discounts they used, shipping you absorbed, items they returned, and the margin of what they actually bought.
The difference changes decisions. Acquisition budgets set against revenue LTV systematically overpay for customer segments that spend a lot and return a lot. Shopify's own customer reports group people by when they first bought and by how recently and often they order, all measured on spend; Easy Profit Calculator's customer report measures lifetime value as average net profit per customer instead.
How do you calculate customer lifetime value?
On a Shopify store, add up every order a customer has placed. That is it, and for a store with a year or two of history it is the most defensible version there is, because it is made of things that actually happened. The textbook formula multiplies average order value by how often someone orders by how long they stay, which matters when you have no order history and is unnecessary when you do.
The profit version runs the same sum and then subtracts what those orders cost you: the goods, the payment fees, the shipping you absorbed, any code they used, and anything that came back. Use that one if you buy traffic, because it is the only version that can be compared with what an ad costs.
Averaging across customers gives you the store-level figure. Read the median alongside it if you have a wholesale-sized customer or two, because a single large buyer moves an average in a small store much further than it should.
Why is my lifetime value number too high?
Almost always because of what the calculation quietly left out. Five leaks account for most inflated numbers, and the first one is usually the biggest.
- It only counts customers who came back. Average the people who ordered twice while the one-and-done majority sits outside the sum, and the result describes your best customers rather than your customers.
- It predicts orders that have not happened. Multiplying by an expected lifespan turns a forecast into a number people then spend real money against.
- It uses spend rather than what you kept. Shipping and tax ride along inside the order total, and on a VAT-inclusive store a fifth of that total was never yours.
- Discounts and returns are missing. A customer with four orders and two returns can be worth less than a customer with one clean order at full price.
- It mixes new and old customers. Someone who first bought three years ago has had three years to spend; someone who bought last month has had four weeks.
How far back should you measure lifetime value?
Pick a window and stay with it. Twelve months suits most stores selling something people rebuy, because it covers a full run of seasons and most repeat cycles without waiting three years for an answer. A store selling something bought once every five years is really measuring referrals, and a subscription business can read a shorter window because the pattern shows up fast.
The trap is comparing groups of different ages. Customers who first bought in January have had six months to come back, and customers who first bought in June have had a few weeks, so on total value the January group wins every time and tells you nothing. Compare them at the same age instead: what January was worth after 30 days against what June is worth after 30 days.
A young store does not have a lifetime value yet, and that is fine. Until there is a year of orders behind you, watch the share of orders that come from repeat customers and the profit on second orders. Both move earlier and both say the same thing sooner.
What do you do with the number once you have it?
The main job is setting a ceiling on what a customer is worth buying. If profit lifetime value is $70 and you are paying $60 to win someone, the model works only while nothing goes wrong, and the cash comes back so slowly that the bank account feels it long before the spreadsheet does.
- Set the acquisition ceiling from profit lifetime value. Revenue lifetime value is the far bigger number - $380 against $74 in the example below - so a budget built on the wrong one can pay several times what a customer is worth.
- Spend more where people come back. If customers whose first order is one particular product reorder twice as often, that product earns advertising even on a thin first-order margin.
- Time retention to the real gap between orders. Look at how long your repeat customers actually take to reorder, then send the reminder slightly before that, rather than on a schedule someone invented.
- Leave the loss-makers alone. A segment that orders often, buys only on discount and returns a third of it does not become profitable through more attention, and someone who has filed a chargeback twice belongs off the list entirely - which on Shopify means a checkout rule rather than a customer setting.
How do you read lifetime value on a real store?
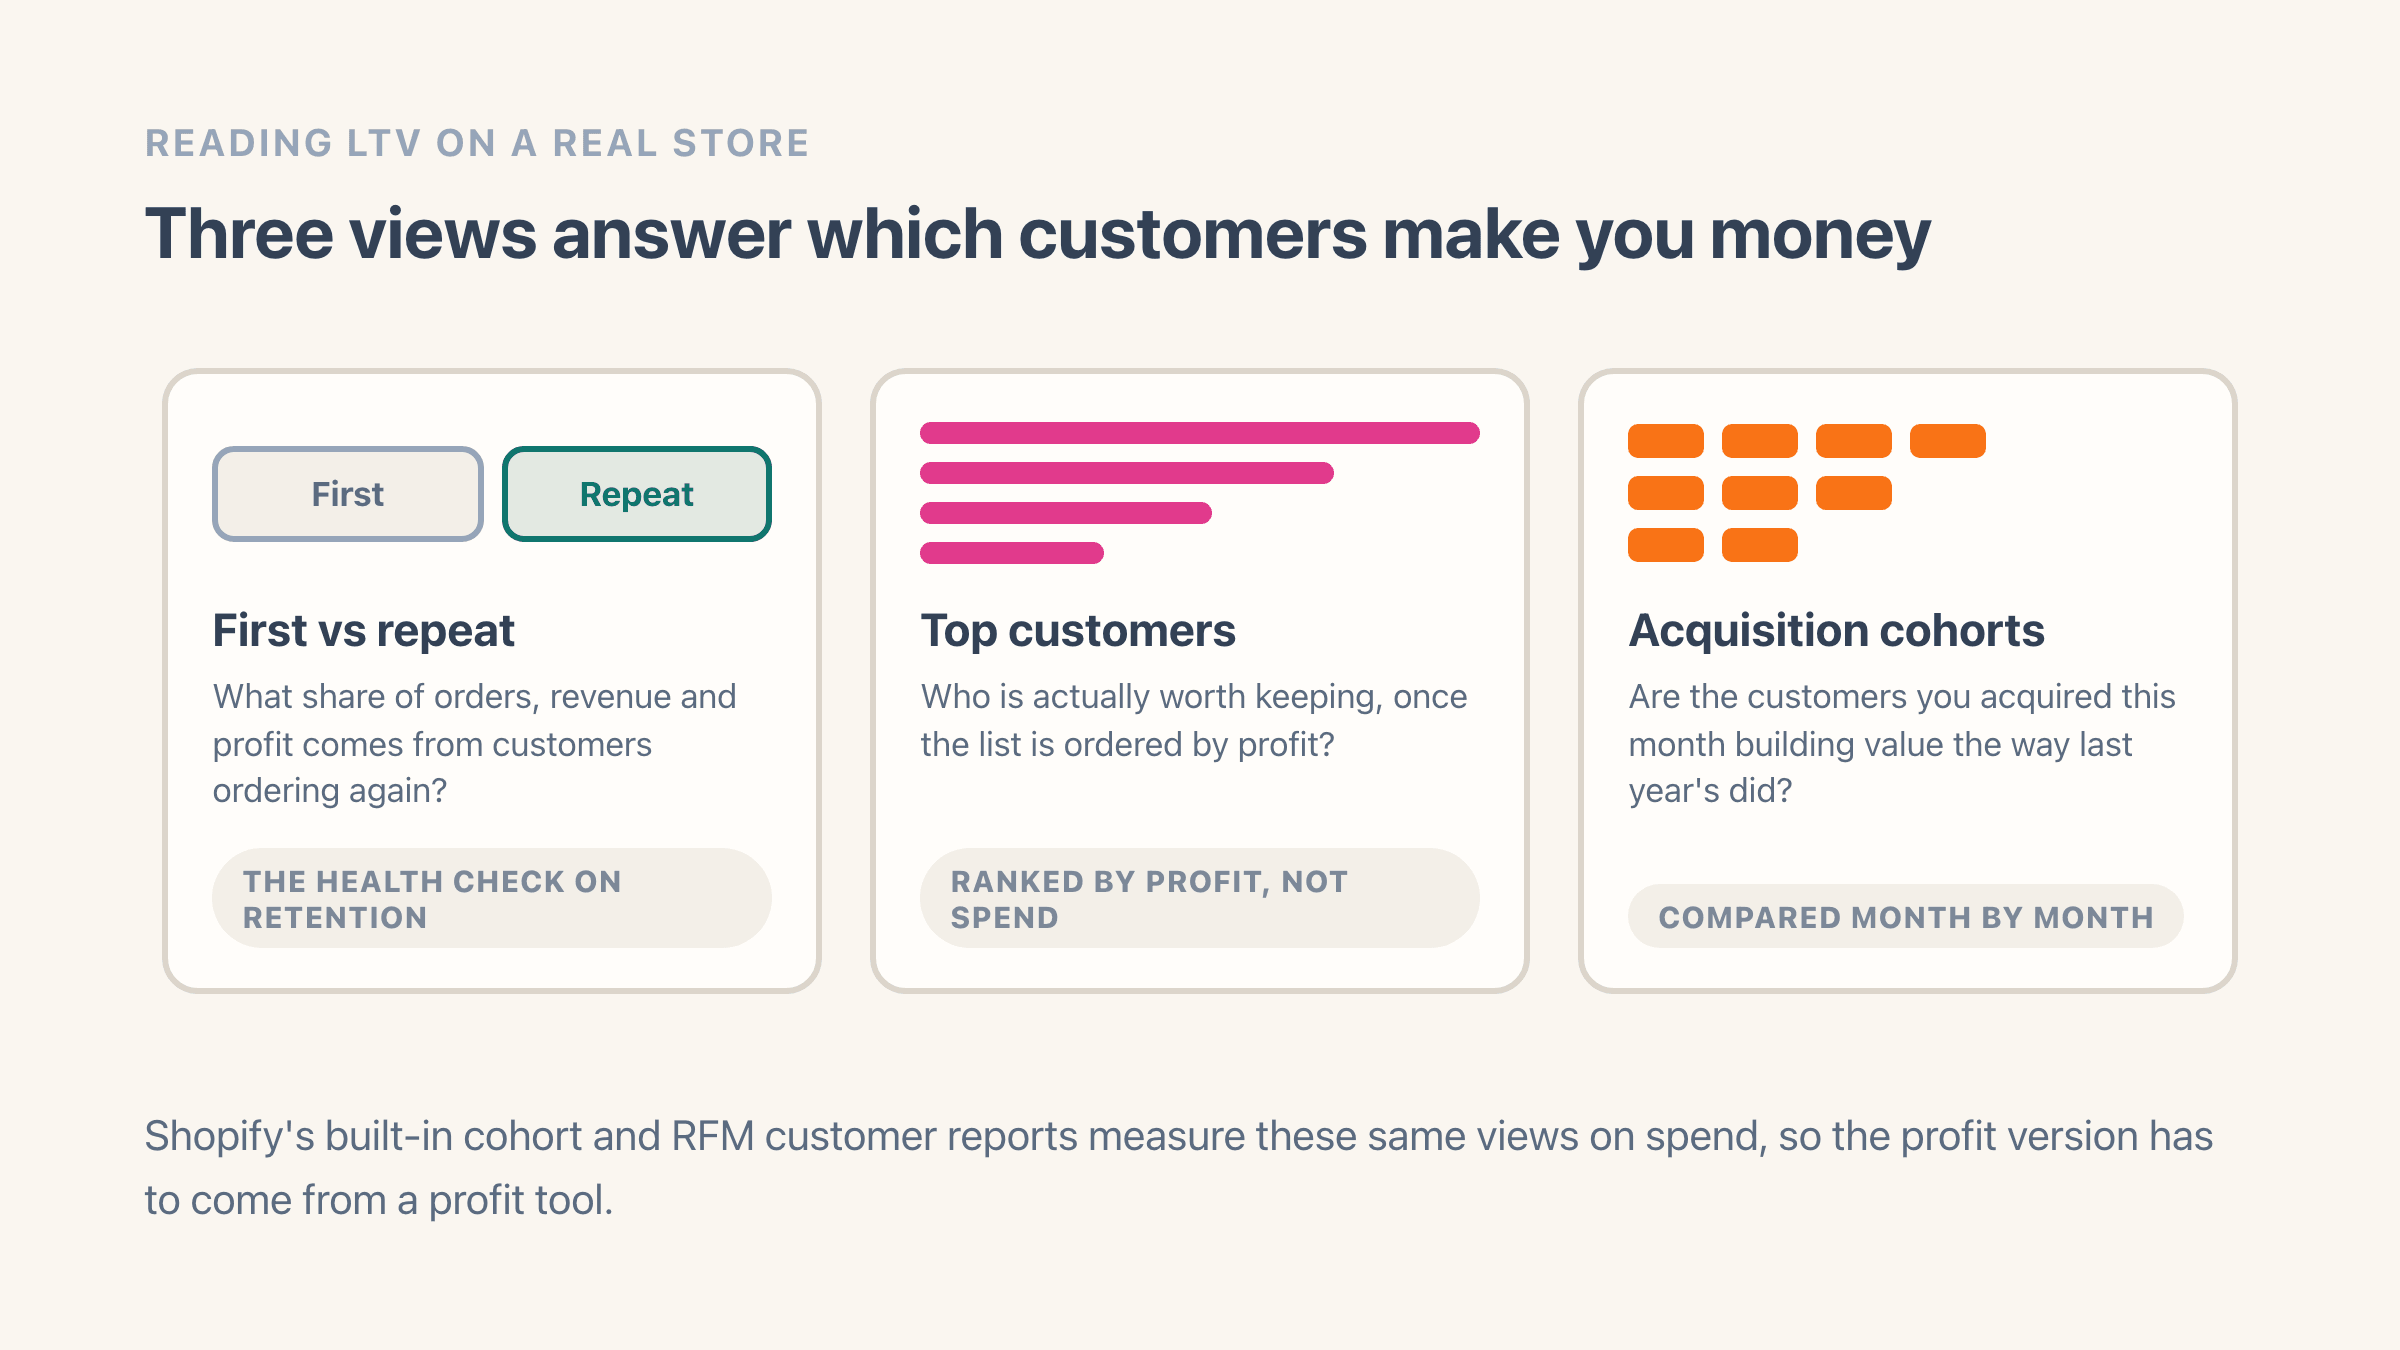
Three views do most of the work. First-vs-repeat: what share of orders, revenue and profit comes from customers ordering again - the health check on retention. Top customers: who is actually worth keeping, ranked by profit rather than spend. And acquisition cohorts: whether the customers you acquired this month are building value the way last year's did.
Easy Profit Calculator's customer report holds all three, measured in profit, with a row per first-order month so the age comparison is available rather than assembled by hand. Customers appear as "Customer #" plus the last six characters of their Shopify ID, never names or emails, so the report tells you what a customer is worth without turning into a copy of your customer list.
If repeat economics run your business - subscriptions, consumables, or working out how long a customer takes to pay back what you spent to get them - a dedicated lifetime-value tool goes deeper; see our Lifetimely comparison. For most stores, profit-based lifetime value plus monthly cohorts answers the question that matters: which customers make you money.
Example
A customer places 4 orders totalling $380. After product costs, fees, shipping and one return, the profit across those orders is $74. Revenue LTV: $380. Profit LTV: $74.
Where it lives in your Shopify admin
Customers > open a customer for their orders and what they have spent with you, and Analytics > Reports > the Customers category for Shopify's cohort and repeat-customer reports. Every one of them measures spend rather than profit, which is the whole gap this page is about.
Commonly confused with
- Average order value
- AOV is what one order is worth. Lifetime value is what every order from that person adds up to, so a low AOV and a high lifetime value describe a perfectly healthy customer.
- Customer acquisition cost
- CAC is what you paid to win the customer. Lifetime value is what they are worth once you have them, and neither number means anything without the other beside it.
- Revenue LTV
- Revenue LTV counts what a customer spent. Profit LTV counts what you kept, and the gap between them is the discounts they used, the shipping you absorbed and the items they sent back.