Short answer
How do you work out what your stock is worth?
Make sure your products have costs
Value at cost is only as complete as your costs are.
Anything you have already typed into Cost per item in Shopify is picked up on its own; for the rest, import a spreadsheet of costs on any plan, or set a cost rule that fills a whole vendor or product type at once on Pro.
Variants with no cost count as zero, and the report shows a banner when that is happening.
If it does not work
The total comes out far lower than you expected because variants with an empty cost are counted as free rather than left out. The banner at the top of the report is the tell, and on a catalogue that grew through imports it is usually a whole vendor missing rather than a scatter of odd products.
How to undo it
A cost entered wrong is simply edited or re-imported over the top. The report values what you hold today at whatever the cost says now, so a correction shows up on the next read.
Open the inventory value report
The locations table totals your current stock at cost and at retail, with unrealized margin (the gap between the two), margin percent and SKU count per location, plus an all-locations total.
If it does not work
Your figure disagrees with your accountant's and neither of you is wrong. The report values what is physically on hand right now, so goods you have paid for that are still in transit are not in it, and retail value moves whenever you run a sale even though no unit has left the shelf.
Turn on snapshots for month-end numbers
Choose weekly or monthly snapshots, or take one right now. From then on you can switch the "Stock as of" date to any saved snapshot and read that day's totals - which is exactly the month-end inventory value accountants ask for.
If it does not work
You switch snapshots on in April and then go looking for the 31 March figure. It is not there, because snapshots only record from the day you turn them on. This is the one step worth doing before you need it rather than when someone asks.
How to undo it
Switching snapshots back off stops new ones being taken and leaves everything already saved exactly where it is, so you never lose a month you have captured.
Export the detail when someone needs proof
Each location has a per-product table with SKU, quantity, unit cost, stock value and retail value, and its own CSV export. Snapshots store the same detail going forward, so a saved date exports too.
If it does not work
The spreadsheet holds more rows than the screen did, and it looks like a mismatch. The on-screen table per location shows the hundred most valuable items, while the totals and the export cover everything you hold.
What you get
- Stock valued at cost and at retail, by location
- Unrealized margin per location: retail value minus cost value
- Weekly or monthly snapshots for month-end reporting
- A stock-value trend since your first snapshot
- CSV export on every plan, including free
Why cost and retail are both worth watching
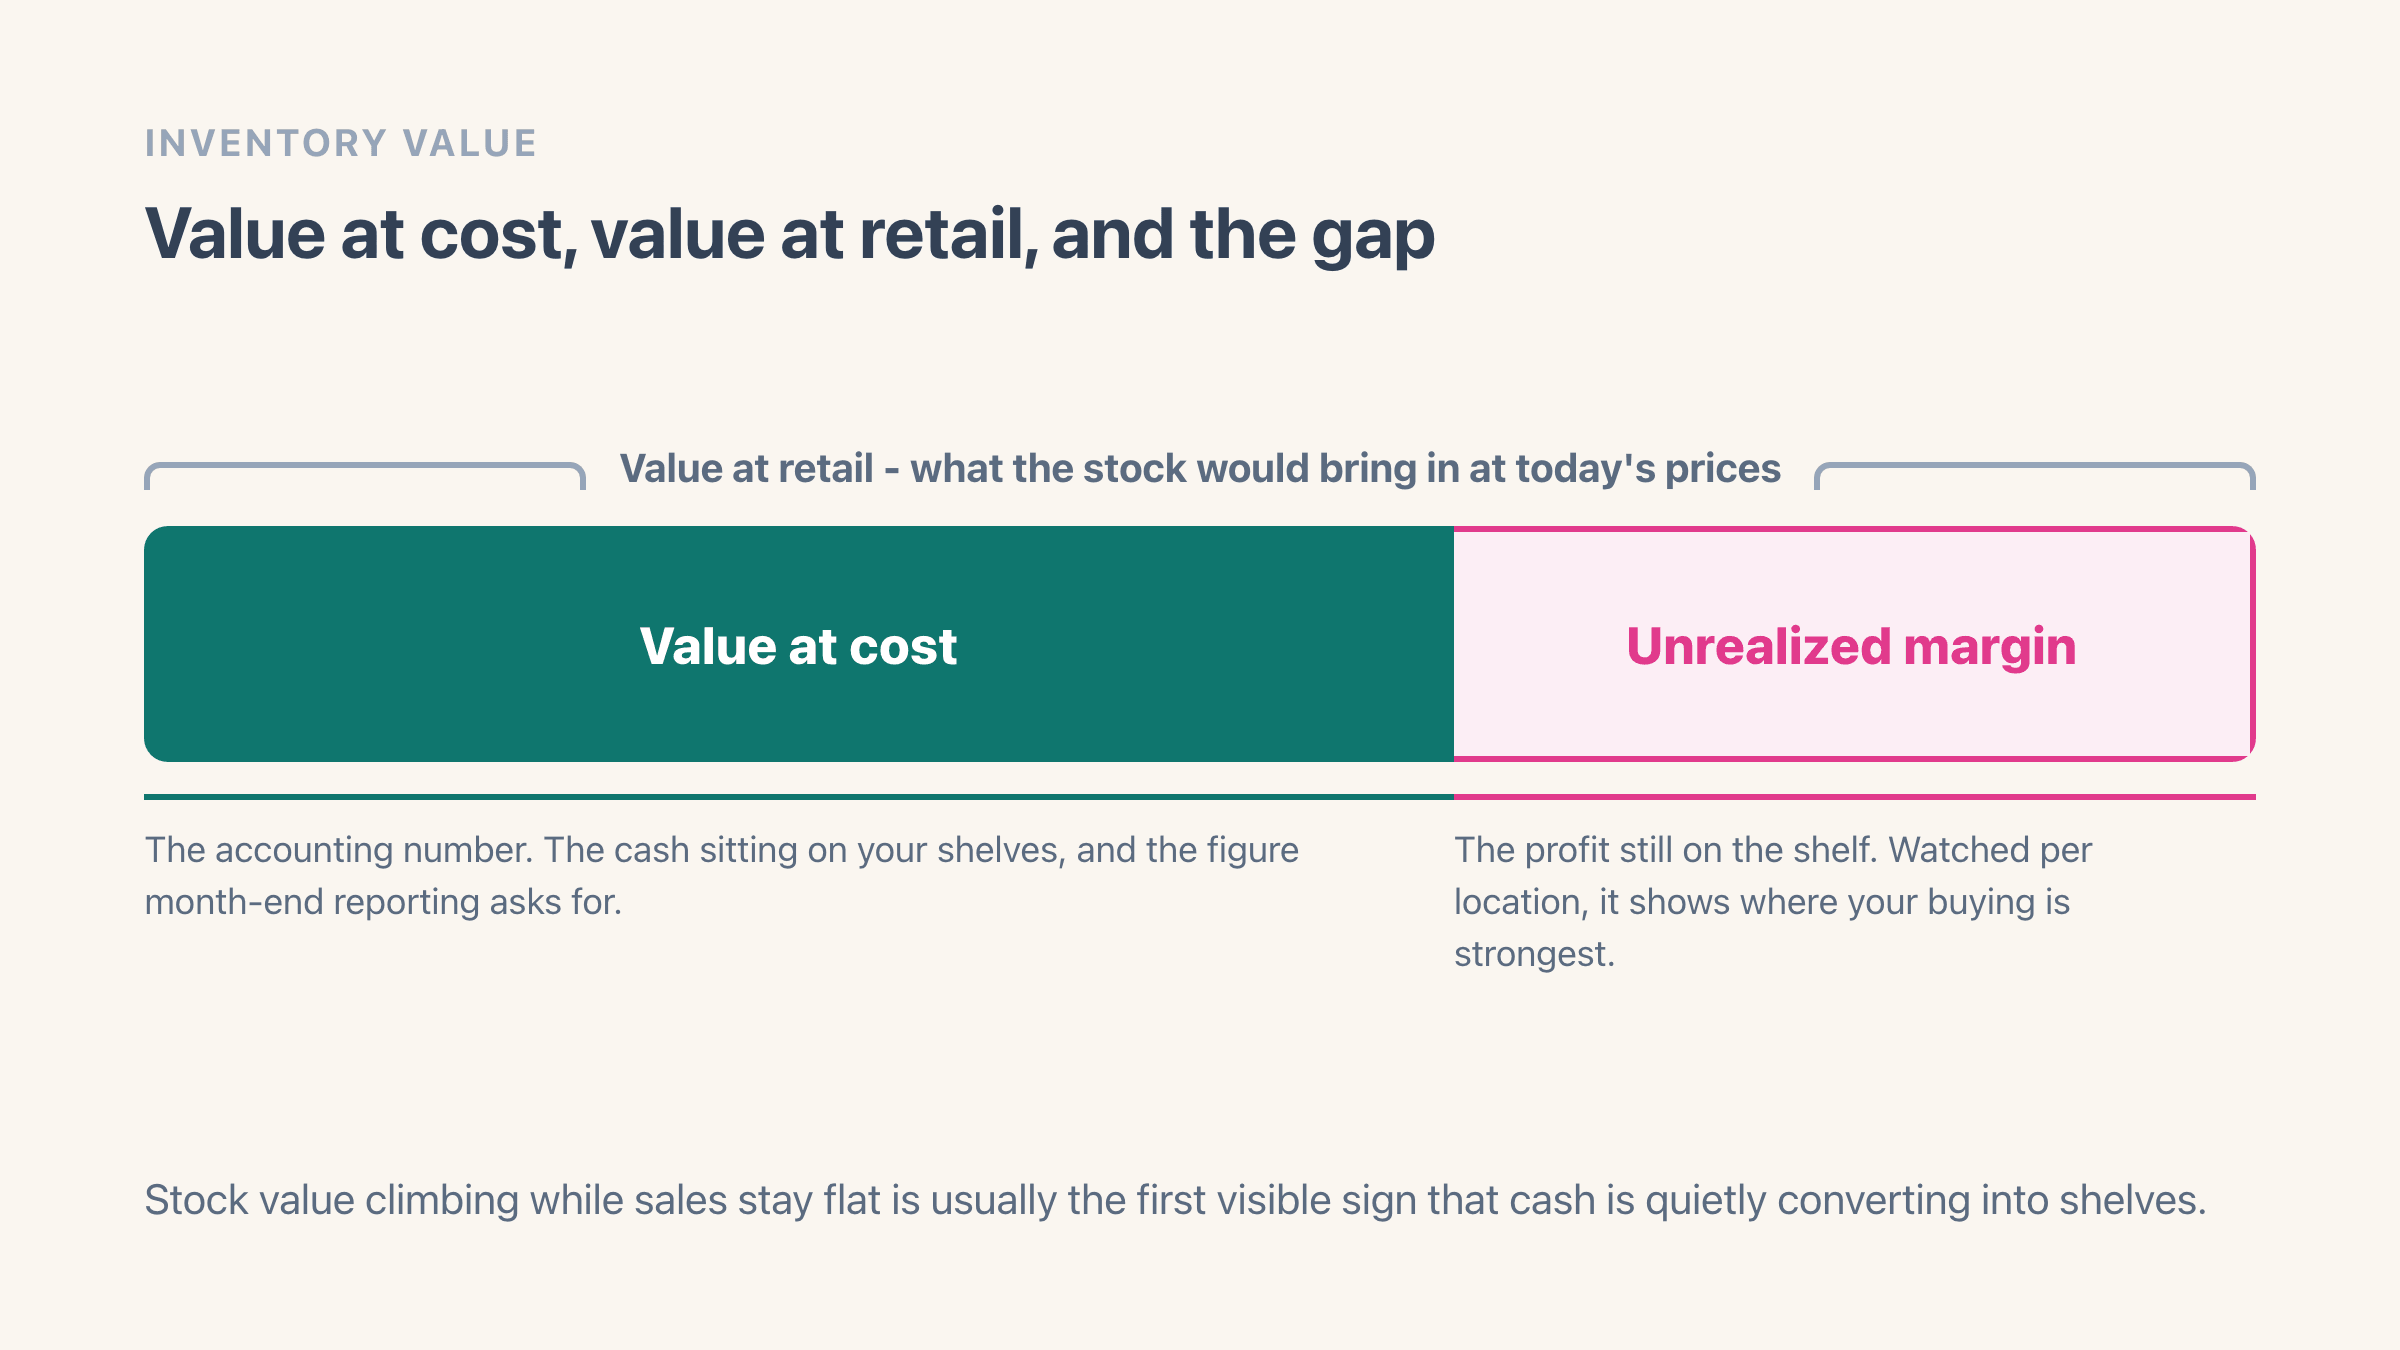
Value at cost is the accounting number: the cash currently sitting on your shelves, the one that belongs in month-end reporting. Value at retail is the commercial one: what that stock would bring in if it all sold at current prices. The gap between them is your unrealized margin, and watching it per location tells you where your buying is strongest.
The trend line matters more than either single number. Stock value climbing while sales stay flat means cash is quietly converting into shelves - usually the first visible sign of an overbuying problem.
How do you find the stock that is not worth keeping?
Start from the value, then ask which part of it has stopped moving. The products not selling report, on the Pro plan, lists the stock with no recent sales alongside its cost, its price and the likely reason it is sitting there, which turns a number on a shelf into a shortlist you can act on.
The inventory profit health report, on Business, goes further and scores where stock value and profit pull in opposite directions - the lines carrying cash but little margin, the ones heading for a markdown, and what you would recover by clearing them at various prices.
For the month-end routine, schedule the inventory value report by email so the numbers arrive without anyone remembering to pull them. Scheduling needs Pro; viewing the report and exporting the spreadsheet work on the free plan.
Can you get inventory value from Shopify without an app?
You can, for a small catalogue and a single location. Every variant already carries what it cost you in the Cost per item box on the product page in your admin, and your on-hand counts live under Products > Inventory. Export both to a spreadsheet, multiply cost by units, and add the column up.
That works fine if you have thirty products, one place to store them, and you need the number once a year for the accountant. I would not pretend otherwise, and if that is you, close this page and go do it.
It stops working at the point you need the number more than once. A spreadsheet cannot tell you what your stock was worth on 31 March once April has moved it, so a month-end figure has to be captured on the day or reconstructed from memory. It also cannot split the answer by location without a lot of manual filtering, and it goes stale the moment a delivery lands.
That is the whole reason the report keeps saved snapshots: the past is the part you cannot recreate. Shopify has the same blind spot on movements rather than values, which we wrote up in seeing inventory history past 90 days.
Why is my Shopify inventory value wrong?
Nearly always because some variants have no cost set. A variant with an empty Cost per item counts as zero at cost, so the total comes out low, and the report puts a banner at the top when stock on your shelves is missing costs. Fill them in on the product page, or use a cost rule to cover a whole vendor or product type at once.
Three other things move the number and surprise people. The report values what is on hand right now, so goods you have paid for that are still in transit are not in it. Retail value uses today's prices, which means a sale changes your inventory value without a single unit moving. And the per-location tables show the hundred most valuable items each, so the on-screen list is a top slice while the totals and the spreadsheet export cover everything.
The last one only bites European stores. Your listed prices include VAT on a tax-inclusive store, so retail value and the margin sitting in your stock would both read high if they were taken at face value. Easy Profit Calculator works out how much tax is inside your prices from your own recent orders and takes it out before comparing retail against cost, so the margin you see is the money you would keep and not the tax you would collect.