Short answer
How do you open the discount code report?
Filter the report list down to Sales
In your Shopify admin, open Analytics, then Reports, then click the Category filter and choose Sales. Sales by discount codes is the one you want, and it groups your sales by the discount that was applied.
A second report sits under Finances rather than Sales, called Discounts by order, which is the same money from the accounting side, split into line-item discounts (the ones applied to a single product) and order-level discounts (the ones applied to the order as a whole).
If it does not work
The report list comes back empty for a staff member. Shopify's analytics page says staff members require the Analytics permissions to access the reports and dashboards, so the fix sits on that person's staff account rather than in the report.
Set the date range before you read a single number
Every figure in the report moves with the range at the top. Set it to the window the promotion actually ran in, then switch the comparison on if you want to see whether the give-away is growing month over month.
If it does not work
A code from last month's campaign shows one lonely order and looks like a flop, because the report is still sitting on the last 30 days and the campaign ended before that window opened.
Read Orders and Discount amount side by side
Orders is how many orders carried that discount. Discount amount is what it handed over. Forty orders that gave away $180 and four orders that gave away $180 are two completely different findings, and on a revenue chart they look the same.
If it does not work
You sort by Total sales and crown the winner. Shopify defines total sales as gross sales less discounts and sales reversals, plus taxes, duties, shipping charges and fees, so tax and shipping are sitting inside that column and it is not the revenue the code brought in.
Export once the list runs long
Shopify's reports documentation says reports display a maximum of 1,000 rows, that the totals still cover every row even when only 1,000 are loaded, and that exporting is how you reach the rest. Any store handing out a unique code per customer passes 1,000 codes fast.
If it does not work
You scroll to the bottom, add up the codes you can see and find they do not match the total at the top. The total already counted the codes below the cut-off.
How to undo it
Exporting reads your data and writes nothing. Delete the file and the report is exactly where it was.
Attach a code to a marketing campaign if you need sessions
Open the discount in the Discounts section of your admin and create a shareable link.
Shopify's help page says that choosing an existing marketing campaign adds that campaign's UTM identifier and source to the link automatically, so the discount then shows up in your marketing campaign reports alongside sessions.
If it does not work
The campaign report shows a fraction of the orders the code's own row shows. The link measures the people who arrived through it, and anybody who typed the code in from an email footer, a podcast read or a card in the box never touched it.
How to undo it
A shareable link changes nothing about your orders. Generate a fresh one against a different campaign whenever you like, though clicks already recorded stay attributed to the campaign they arrived under.
What does the Sales by discount codes report actually show?
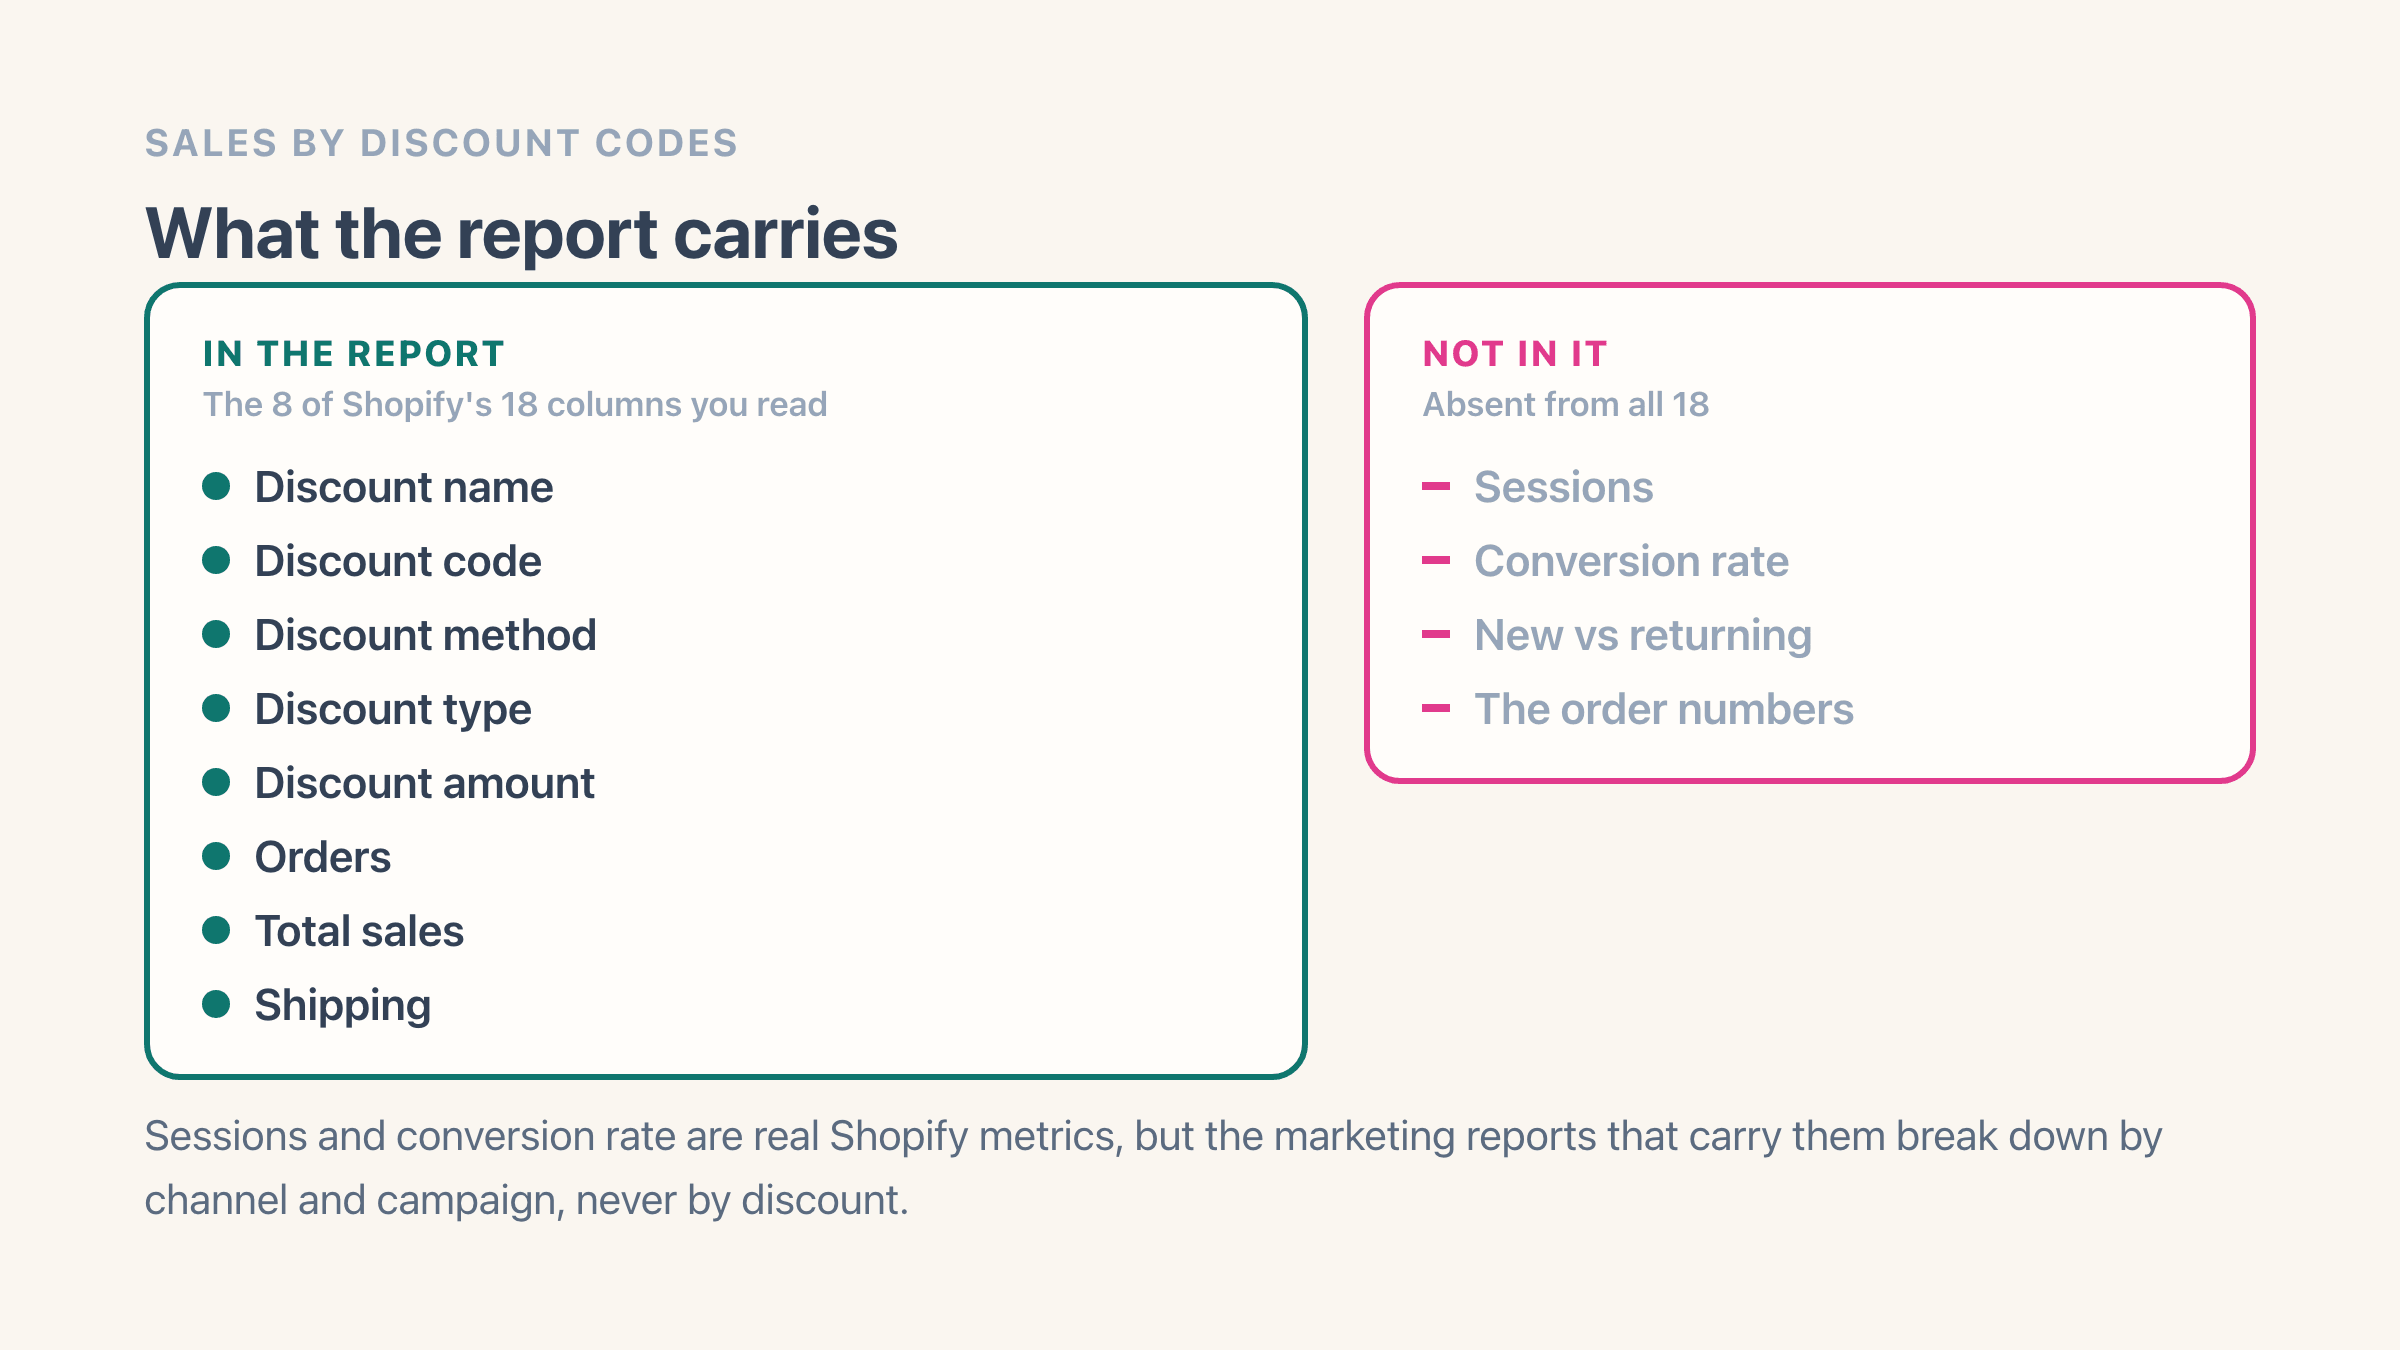
Shopify's sales reports help page publishes the whole column list, and it runs to eighteen. The eight a merchant actually reads are the discount name, the discount code, the discount method, the discount type, the discount amount, orders, total sales and shipping.
The other ten are mostly the same money sliced finer: shipping discounts kept apart from non-shipping ones, the other discounts that landed on the same orders, and a discount class column that tells you whether Shopify filed the discount under shipping, product or order.
Shopify describes the report as showing "your sales grouped by the name of the discount, such as the automatic discount name or discount code". That wording matters, because grouping by name is what puts automatic discounts and codes in the same table.
Total sales is the column people rank by, and it is the wrong one for the job. Shopify defines total sales as gross sales less discounts and sales reversals, plus taxes, duties, shipping charges and fees, so tax and delivery charges are sitting inside the figure. It answers what the till took on those orders, never what the code brought in.
Two script discount columns exist as well. Shopify says they display only if you use Shopify Plus, and that a script discount is reported for an order only when a discount code was used on that order too. On every other plan they are simply not there.
Can you see conversion rate by discount code?
One boundary worth stating rather than glossing over, because the missing column here is not a missing metric. Shopify publishes a metric list for its marketing reports too, and conversion rate is on it, alongside sessions, orders, cost and return on ad spend. What that list never offers is a discount code to read them against: those reports break the numbers down by referring channel, marketing activity and campaign.
Why does one order show up under two different codes?
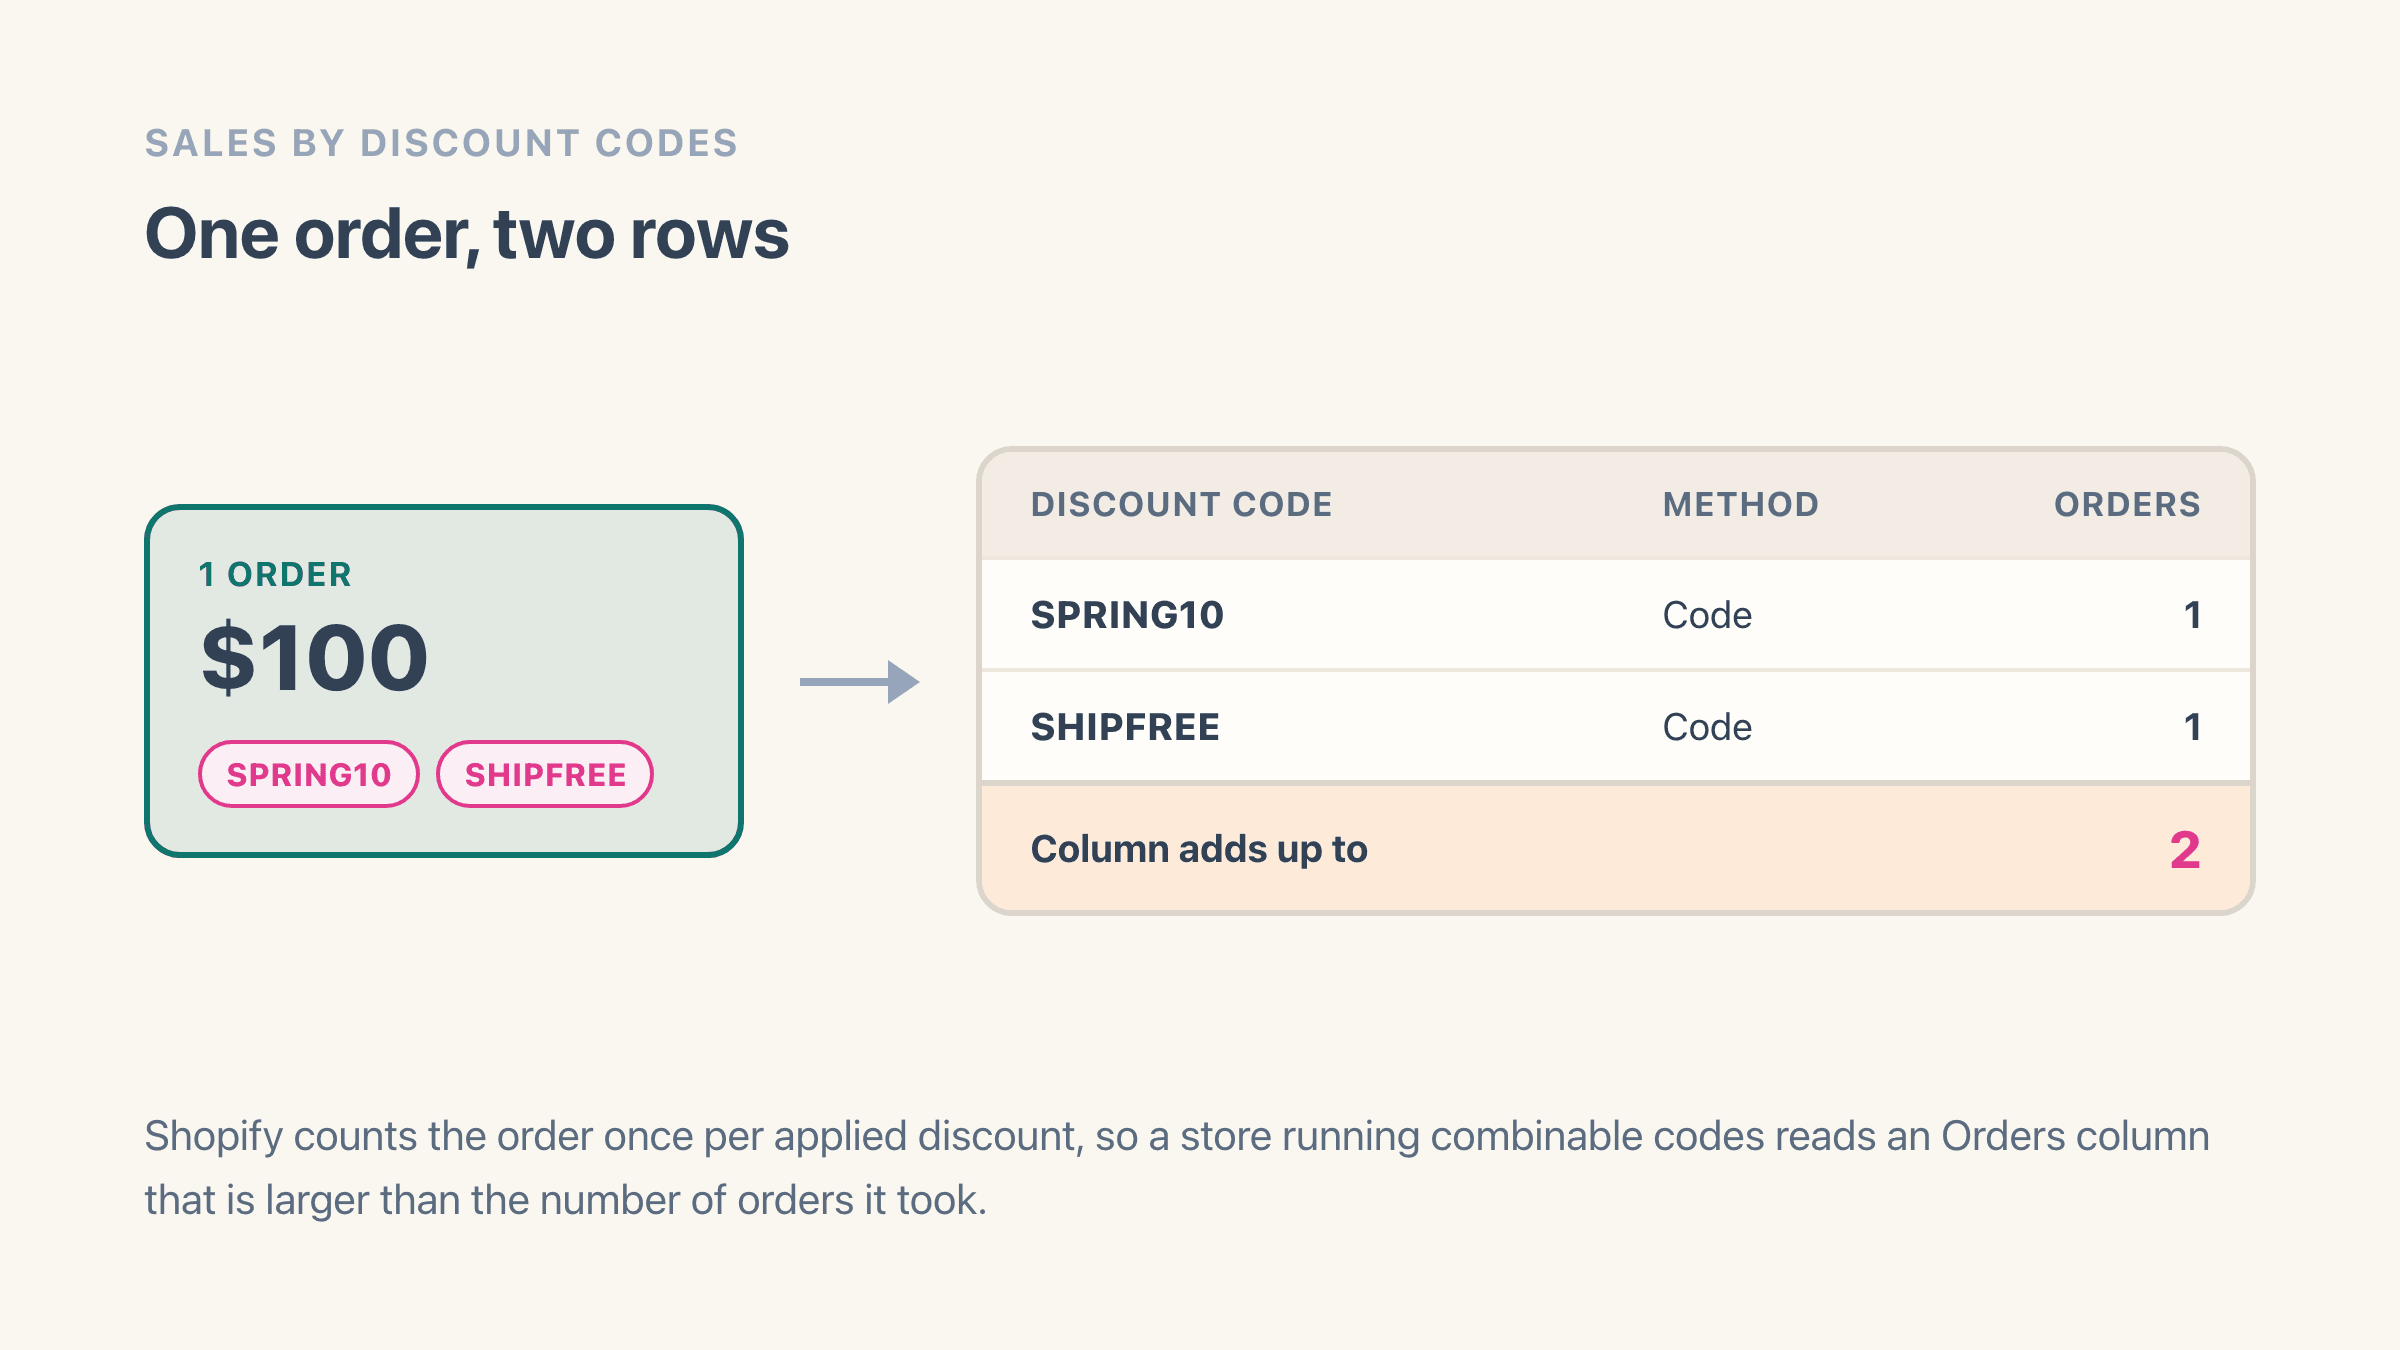
Because the report gives every discount its own row, and an order that used two of them belongs in both. Shopify states the rule plainly on the same sales reports page: "If you have combinable discounts on your store, then the same order might be included multiple times. The order displays one time in each row for every applied discount."
Take a customer who buys $100 of products and uses two codes you have set to combine. SPRING10 takes 10% off, so $10. SHIPFREE waives the $6 you would have charged for delivery. That one order lands in the SPRING10 row and in the SHIPFREE row, and the Orders column reads two.
The same page says the sales value on each row covers only the total sales for the line items the discount affected. It does not spell out what that means for a shipping discount, which affects no line item at all, so the two rows are not two copies of the same $100. Treat any per-code figure as approximate on orders that used more than one code.
Shopify caps this at five product or order discount codes plus one shipping discount code on a single order, and it allows a maximum of 25 active automatic discounts. Combining only applies to orders placed through your online store, Shopify POS or a custom-built storefront.
Can you see which orders used a discount code?
Yes, but not from the report. The report is a summary and no column in it names an order. The list of orders lives on your Orders page, which carries a filter Shopify describes as "Filter orders where a specific discount code was applied at checkout".
So the route is: Orders, filter, Discount code, pick the code. You get the real orders, and you can open any of them to see what else was on the basket.
Exporting that filtered list has a quirk worth knowing before you need it. Shopify sends up to 50 orders, or the current page, straight to your device. Ask for more than 51 orders, or export by date, and the file is emailed to you and to the store owner instead, so every big export you run puts a copy in your owner's inbox.
Why is there no conversion rate for a discount code?
Because the two halves of the sum are kept in different reports. The discount report is built from orders, so it can count orders and money. Sessions and conversion rate live on the marketing side of analytics, where Shopify groups by referring channel, marketing activity and UTM campaign.
Nothing joins a discount code to a session on its own. Shopify's marketing performance page does list conversion rate among the metrics you can view, next to sessions, orders, cost and return on ad spend, so the metric exists and Shopify documents it. What no report we could find lets you read it against is a discount code.
The nearest native workaround is the shareable link in step 5. It gives the code a campaign, and the campaign gets sessions. What it measures is the link, so a code you also print on a flyer will always look worse in the campaign report than it did in the discount report.
For a small store the workable line is simpler. Judge codes on orders and give-away, and reach for a campaign link only where the traffic source is genuinely the question you are asking.
How do you tell new customers from returning ones on a code?
The report has no column for it, and the obvious workaround has a hole in it. You can restrict a discount to a customer segment, but Shopify says a discount specific to customer segments "applies only to existing customers", because a first-time buyer has no customer profile yet and does not join a segment until their first order is complete.
That is why a welcome code cannot enforce being new. It can only be a code you send to people you believe are new.
The practical answer most stores land on is two codes with two names, one used in acquisition channels and one used in the emails that only existing customers receive. The report then separates them for you, because it separates by name.
We run our own store this way. What it costs is discipline rather than money: the day somebody forwards the welcome code to a regular customer, the split quietly stops meaning anything, and the report has no way to tell you that happened.
Merchants do ask Shopify for the split itself. The community thread on tracking codes by new versus repeat use is one of them, and every answer on it is an app.
What makes the numbers look wrong?
Almost always one of two things sitting outside the report, or one of five documented behaviours of the report itself. None of them is a bug, and none of them is guesswork.
Start with the two outside it. A staff member who opens Reports and sees an empty list is missing the Analytics permissions, which Shopify says are required to access the reports and dashboards at all. And a code showing one lonely order is very often a code whose campaign ran outside the date range still sitting at the top of the page.
If a guide tells you the report lags a day behind, check when it was written. Shopify's current sales reports page says that when you open a sales report, the data is up to date, give or take about 1 minute. We have seen that claim repeated on pages dated 2020 and 2021 that nobody has revisited since.
Inside the report, five behaviours account for nearly all of the rest.
- Combinable codes duplicate an order across rows, so the Orders column overcounts.
- Reports display a maximum of 1,000 rows, while the totals still count everything.
- Test orders are excluded, and pending, unpaid and canceled orders are included.
- Deleting an order, customer, product or variant removes its data from the reports.
- The report only covers sales made after 1 May 2017, 12:00am UTC, whatever your store timezone is.
What replaces the WooCommerce coupons report on Shopify?
Sales by discount codes is the closest equivalent, and it is a fair swap on the basics. Both give you the code, the number of orders and the money involved, and both let you set a date range and export.
Two differences catch people out on the way over. Shopify groups by discount name rather than by code, so an automatic discount with no code at all still gets a row. And Shopify puts the list of orders behind a code on the Orders page rather than in the report, which is the step people go looking for and cannot find.